Tag Archives: Snowstorm

WEEKEND WEATHER FORECAST

Mon 5:00 PM —Forecast Review — That was quite a storm with heavy snow and accumulations, as always dependent on location. The NWS has a web page for what’s considered semi-official snow accumulation totals. Here’s a sample—

Was the snow storm really a ‘Blizzard” as defined by NOAA? A review of the NWS KPHL website shows only about 1 hour visibility of 0.25 mile or less, instead of the defined 3 hours. Wind gusts were not sustained at over 35 mph for 3 hours either. So, while the storm will likely be remembered as the “Blizzard of 2026”, it really wasn’t. (Areas near the shore likely qualified for the blizzard designation.)

A few things about the models. Timing the transition from rain to snow was very good. Perfect snow total predictions are never achieved, just as rainfall is never exactly as forecast.

It should be remembered that the GFS model did much better than the ECMWF with this storm, for days in advance. The ECMWF-AI did much better than the regular ECMWF. The Canadian models were under-performers as was the German ICON model. The new RRFS, waiting to be released, was very disappointing, especially with its forecast at 60 hours and 84 hours in advance. However, the 24 hour snow forecast was very good.

The old NAM did much better than the RRFS at 60 to 84 hours. The NBM median was pretty good, maybe a tad high in some areas.

Snow Tapering Off

Posted Monday 02/23/26 @ 9:51 AM — The storm is well to our east and the vertical motion (Omega) near and west of Philadelphia has turned to a downward motion. Snow continues to rotate around the low into the city from the northeast along the 700 mb (~10,000 ft) wind direction but as it meets downward vertical motion, it should taper off. Additional scatted snow showers still possible into early afternoon near the city.

Radar and MRMS radar at 9:37 AM with superimposed RAP model 700 mb wind streams (green and green arrows) and Omega (yellow contours and yellow labels) Negative indicates downward motion.

Additional snowfall from the 13z NBM (8AM) run is minimal west of the city.

13z NBM Additional Median snowfall accumulation from 8 AM through 1 PM. Line contours are 1 inch increments (labeled). (Click on image for a larger view.)

I’ll do a wrap up and forecast review later today.


Additional Snowfall

Posted Sunday 02/22/26 @ 10:27 PM — Despite the afternoon’s models suggesting a more eastward track, the latest model blend (NBM) shows significant additional snow from 8 PM through 4 PM. (In the city, snow tapers to just snow showers/flurries by 12 PM)

01z NBM median snowfall (additional) from 8 PM to 4 PM Monday. Line contours are 1 inch increments (labeled). (Click on image for a larger view.)

If this holds, the NBM mean snowfall (appeared too high) did the best at predicting this storm’s snowfall.

Updates Monday morning.


Storm Update

Posted Sunday 02/22/26 @ 5:58 PM — Folks, I violated my own cardinal rule- “never look at the new model runs when the storm is in progress”.

The reason: it always changes and you never know if it’s a dramatic change in the forecast or if it’s a model “spin-up” error. Put another way, the latest models are not often not the best once a storm is in progress. I mentioned this aspect this this morning.

So, I looked at the latest GFS and RRFS models (18z) , and I shouldn’t have been surprised that the predicted snow amounts are significantly less. Is this a real change? Or a spin-up error?

(Models literally re-create the atmosphere mathematically; they often have a multi-hour “spin-up” time for the model to come close to matching the atmosphere.)

Anyhow, here’s the latest RRFS, which has cut back the snow totals. (The GFS has gone even lower to only 6 inches in Philly.)

18z RRFS has cut the totals significantly near the city and westward. Is this a real change in the forecast?? (Click on image for a larger view.)


Snowstorm Update

Posted Sunday 02/22/26 @ 3:51 PM — As forecast, it started snowing between 3 and 4 PM in many areas. Near ground temperatures are still above freezing, according to the RTMA, (however the hourly RAP model indicates that temperatures about 800 feet above ground are at or below 32º) —

3:30 PM RTMA analysis Most areas are having snow but are above freezing at this time. Line contours are 1 degree increments (labeled). (Click on image for a larger view.)

The 1 PM (18z) HRRR has chimed in with its snow forecast and it remains in the range I’ve been supporting—

18z HRRR snow accumulation -snow depth by 1 PM Monday. (Click on image for a larger view.)

Last but not least, the latest NBM run with updated precipitation (19z) is available and the median snowfall has increased from the last run. I’m still placing bets on the median snowfall. (hard to believe, but the mean is even greater)

19z NBM with updated precipitation stats. Median snowfall (Median = Half the models comprising this ensemble are showing more than these values, half are showing less.)

Sunday Storm Update

Posted Sunday 02/22/26 @ 11:50 AM — The latest RRFS finally caught up with the rest of the models regarding snow accumulation—

Today’s 12z RRFS – Snow accumulation. Calculated values. Line contours are 1 inch increments (labeled). (Click on image for a larger view.)

Additionally, a newer run of the NBM (13z) showed somewhat higher median snow totals than what was posted earlier.

No real change in the timeline. Snow starts accumulating between 2 and 4 PM RRFS model—

Snow accumulation time line for Blue Bell PA (Click on image for a larger view.)

Winds

Wind Meteogram for Blue Bell PA Further east, winds and gusts approach 50 mph. (Click on image for a larger view.)

Sunday Storm Update

Posted Sunday 02/22/26 @ 8:28 AM — The models show little change from last night, perhaps a bit higher snow totals. The ECMWF’s low pressure position finally caught up with the position the GFS was forecasting all week. (Who says the ECMWF is the Mercedes and our GFS is a Chevy ?) Here’s the current position of the low—

Water Vapor image at ~ 8 AM with superimposed RAP model MSL pressure (black contours). and GFS & NAM potential vorticity contours (violet and yellow fine contours) When the purple and yellow lines (potential vorticity) meet up with the coastal low, deep intensification will occur. (Click on image for a larger view.)

Time line is similar to that posted yesterday. Current rain or rain/snow mix changes more to snow around noon or 1 PM. Then all snow by 3-4 PM in the city and westward. Accumulations start about 4 PM or so. The storm tapers and ends around 11 AM- noon Monday. Some additional snow showers possible in the afternoon.

Here are some of the latest snow accumulation totals—

NAM built-in algorithm— (Generally too low)

Today’s 06z NAM snow depth totals as of 11 AM Monday Line contours are 1 inch increments (labeled). (Click on image for a larger view.)

The NBM median and mean (implying higher certainty) are reasonably close together and I’m going with the median snow accumulation below (the mean values are even higher!) —

This morning’s 12z NBM median snow accumulation (calculated) Line contours are 1 inch increments (labeled). (Click on image for a larger view.)

The GFS built-in snow depth values are about 1 inch less than the the NAM shown above.

Here’s my “experimental” values calculated on GFS data of precipitation and temperatures at 4 levels and water-snow ratio; they are similar to the NBM median—

Experimental GFS calculated snow totals. I’m happy to see they’re not that much different than the NBM median values. Line contours are 1 inch increments (labeled). (Click on image for a larger view.)

At this point, with consistent model forecasts, I’m not inclined to change my forecast. Any newer models today may not have the proper ‘spin-up’ time to capture the atmosphere.

I know my snow forecast with this storm is different and higher than forecast by the TV forecasts and the NWS.

Interestingly, the RRFS and REFS (expected to become operational soon) are in the 8-10″ range for the city. I’m somewhat disappointed that both models are slow to pickup this storm at 60 and 84 hours and are perhaps forecasting snow totals. that are too low, especially the RRFS.

I guess we’ll see what happens.

I’ll update during the day as needed.


Final Storm Thoughts for this Evening

Updated Saturday 02/21/26 @ 11:40 PM —Based on tonight’s models, I’m thinking the TV forecasts of 8-12 inches of snow near the city may be too low. I’m staying with the NBM median and even my experimental forecast below.

Posted Saturday 02/21/26 @ 8:51 PM — The snow totals forecast I heard on TV this evening was 8-12 inches. A reasonable number, and depending on how much precipitation falls before 4 PM may make that the correct forecast. However, the latest NBM still shows higher median snow totals as shown earlier.

My GFS snow experimental forecast is much higher and may very well be wrong, especially if much precipitation falls before 4 PM. But here’s the latest in what I’m calling ‘experimental’ forecast based on GFS data —

GFS snow forecast (experimental) based on temperature at four levels and snow water ratio of 10:1 Line contours are 1 inch increments (labeled). (Click on image for a larger view.)

My forecast above isn’t very different than the latest NBM median—

Tonight’s 00z NBM Median snow total forecast. Line contours are 1 inch increments (labeled). (Click on image for a larger view.)

The real time weather analysis (RTMA) shows low pressure just beginning to form off the coast, as picked up by 3 hour barometric change—

8 PM (01z) RTMA shows negative barometric change occurring as forecast off the coast indicating the beginning of low pressure formation. (Click on image for a larger view.)

Final thought for tonight. Snow during this period in February melts quickly. Sun angle is high and even with clouds, radiant insolation is strong. It’s not expected to be frigid afterwards like after the last storm.


Sunday Snowstorm Update

Posted Saturday 02/21/26 @ 4:46 PM — Let me address a few things that were not given attention to.

Current water vapor shows the storm beginning to form near SC coast—

Current satellite water vapor image with superimposed RAP model 500-1000 mb thickness lines (yellow), Mean Sea Level Pressure isobars (black contours) potential vorticity (fine violet contours) with superimposed MRMS RADAR. (Click on image for a larger view.)

Precipitation starts as either light rain or light snow or a mix as early as 5 AM Sunday near the city.

  • Despite falling as snow by 1-3 PM, little accumulation occurs until 4 PM
  • Winds pick up about the same time. Winds 20 mph gusting to 40 mph.
  • Precipitation ends around 12-1 PM Monday, later somewhat in eastern NJ.
Snow accumulation Meteogram for Blue Bell PA. While little snow accumulates before 4 PM, it will be a rain snow mix as early as 4 AM. Snow ends about 1 PM

The latest NBM (19z) median snow totals are below. The mean totals are much higher. I’m still leaning towards these values.

19z NBM mean snow accumulation totals (calculated) (Click on image for a larger view.)

Where could these totals go wrong? The RRFS has a good portion of the precipitation falling during Sunday but not accumulating. Is it a model error or does it know something the other models don’t? Here’s the RRFS time line—

RRFS has a good portion of the precipitation falling before temperatures allow for accumulation. As a result, it’s prediction is for 5 inches of snow in Blue Bell. It is correct? (Click on image for a larger view.)

I’ll update this evening if things change.


Yet Another Storm Update

Posted Saturday 02/21/26 @ 11:41 AM — The latest GFS just became available. Here’s its built-in snow depth parameter (which I find to underestimate snow accumulations)—

12z GFS snow depth accumulation which I find to underestimate snowfalls. Line contours are 1 inch increments (labeled). (Click on image for a larger view.)

Here’s what I’m calling my “experimental” snow accumulation estimate, using my own algorithm calculations on GFS data—

12z GFS with my own snow algorithm. Maybe it’s not ready for prime-time, but it seems closer to the NAM and HRRR models of the same model run. Line contours are 1 inch increments (labeled). (Click on image for a larger view.)

Updates later this afternoon. Check back.


Winter Storm Update

Posted Saturday 02/21/26 @ 10:17 AM — Additional models have become available. A picture is worth a thousand words—

13z NBM median snow totals. Line contours are 1 inch increments (labeled). (Click on image for a larger view.)
12z NAM snow depth forecast by Monday. Line contours are 1 inch increments (labeled). (Click on image for a larger view.)

Timing update: Light rain and or snow begins as early as 4 AM Sunday. By 9 AM, the latest RRFS shows this precipitation type:

12z RRFS with precipitation type and temperatures at 9 AM. (Click on image for a larger view.)

Precipitation falling as snow does not equate to accumulating snow. Temperatures above freezing with high sun angle and insolation through clouds in late February will likely reduce or eliminate snow accumulation before late afternoon or evening in many areas.

Updates later. Stay tuned.


Winter Storm Update

Posted Saturday 02/21/26 @ 9:24 AM — The models still show some differences in snow totals. What had looked like a uniform move to the higher end last night has splintered again into the lower totaling ECMWF/ECMWF-AI and the NOAA models GFS/NAM/HRRR which are forecasting higher amounts. (For reasons to be determined, the new still unreleased RRFS is in the low end of about 5-7″.) The latest NAM, NBM and others will be available over the next hour or two.

Much, but not all of the storm, now falls into the range of the high resolution HRRR.

The latest HRRR (whose forecasts only extend to 48 hours) includes a part of the storm up to 7AM Monday—

12z HRRR snow depth forecast by Monday at 7AM NOTE that the storm will last longer than covered by the current HRRR, meaning snow totals will be higher than shown. Line contours are 1 inch increments. (Click on image for a larger view.)

I’ll be making additional updates before noon. Stay tuned.


Storm Update

Posted Friday 02/20/26 @ 10:15 PM — A quick update. Tonight’s models have moved towards higher snow totals. The NBM median is almost as high as the mean.

01z NBM median snow totals through Monday. Line contours are 1 inch increments (Click on image for a larger view.)

The latest NAM is even higher. Updates Saturday morning.


I thought I’d share this cool, off the beaten path website with readers. From Iowa State University, it draws snow accumulation meteograms for Philadelphia from the latest GFS and NAM data. Includes algorithms for melting and compaction along with water snow ratios—
https://www.meteor.iastate.edu/~ckarsten/bufkit/image_loader.phtml?site=kphl
Experimental

Posted Friday 02/20/26 @ 5:51 PM — With the soon to be retired NAM, I’ve been working on a snow algorithm with considerable help from Anthropic’s Claude AI that uses my snow forecasting technique derived from the old NAM FOUS data that served me so well years ago. I’ve applied it to the GFS model data. Probably not ready for prime time, but here’s the latest GFS model snow accumulation forecast based on this very experimental algorithm—

18z GFS data with my experimental algorithm for snow accumulation prediction. It might NOT be correct. We’ll find out. (Click on image for a larger view.)

Major Snowstorm Increasingly Likely

Posted Friday 02/20/26 @ 5:18 PM —The models have come and they are all moving towards a major snowstorm for the Delaware Valley and NJ late Sunday into Monday. Details about the timing are below.

First, as described earlier, I’ve resurrected my favorite model for snowstorms in Philadelphia. This will likely be its last snow forecast for our region, since the model will be retired sometime this year when the RRFS becomes operational. Here’s the NAM snow forecast—

18z NAM built in snow depth algorithm. As high as these values are, they might be too low! (Click on image for a larger view.)

I’ll get more into the details as the weekend progresses, but I’m going to cut to the chase and post the latest Model Blend Mean and Median foreasts—

19z NBM mean snow accumulation forecast by 1 PM Monday. Line contours are 1 inch increments (Click on image for a larger view.)

Here’s the NBM median forecast. I’ve been leaning towards the median forecast, but I think it may be too low. Somewhere between the median and mean sounds about right.

18z NBM median snow forecast through 2 PM Monday. Line contours are 1 inch increments (Click on image for a larger view.)

My regular Weekend Weather Forecast is below:

Major Snowstorm Increasingly Likely

Originally Posted Fri 4:55 PM — This weekend’s weather will start tranquil and will likely end much less so.

Here’s the setup as shown in current water vapor imagery—

Current satellite water vapor image with superimposed RAP model 500-1000 mb thickness lines (yellow), Mean Sea Level Pressure isobars (black contours) potential vorticity (fine violet contours) with superimposed MRMS RADAR. On Saturday, we’ll be in the mild orange area to our west. Low pressure in Colorado will move into an area along the southeast coast by Sunday and intensify as it moves up along the coast. At the same time, cold air will be plunging to our immediate west. (Click on image for a larger view.)

Saturday Forecast

Clouds early morning then breaking for sun late morning. Cloudiness returns early afternoon in most areas except southern Chester/Delaware counties. Breezy winds 8-16 mph will make temperatures feel closer to 40º.

NBM high temperatures: Blue Bell, PA 47º Philadelphia, PA 49º
Higher than Average Uncertainty (based on standard deviation): ± 2.4º

Sunday Forecast

Major Snow Storm Likely for our Region

Light precipitation moves in during the morning hours. A mix of snow and rain possible and and where it snows, there will be little accumulation until evening. It will snow despite ground temperatures above freezing because just 1500 feet above ground, temperatures fall off rapidly below freezing.

Near ground temperatures drop towards evening as the storm picks up in intensity. Strong winds and heavy snow likely. Updates through the weekend. Snow tapers off late Monday morning.

NBM high temperatures: Blue Bell, PA 34º Philadelphia, PA 41º
Average Uncertainty (based on standard deviation): ± 1.4º


SNOWSTORM UPDATE

The most important weather model runs, based on global weather balloon (“radiosonde”) upper air measurements, are done twice a day— at 7 PM EST (00 UTC, also called 00z)  and 7 AM EST (12 UTC, also called 12z).

These new upper air measurements often account for any significant change in the model forecasts. The latest NAM-NEST has a decrease in snow totals due to significantly more sleet.

Here’s the latest 00z model data, based on these new upper air measurements.

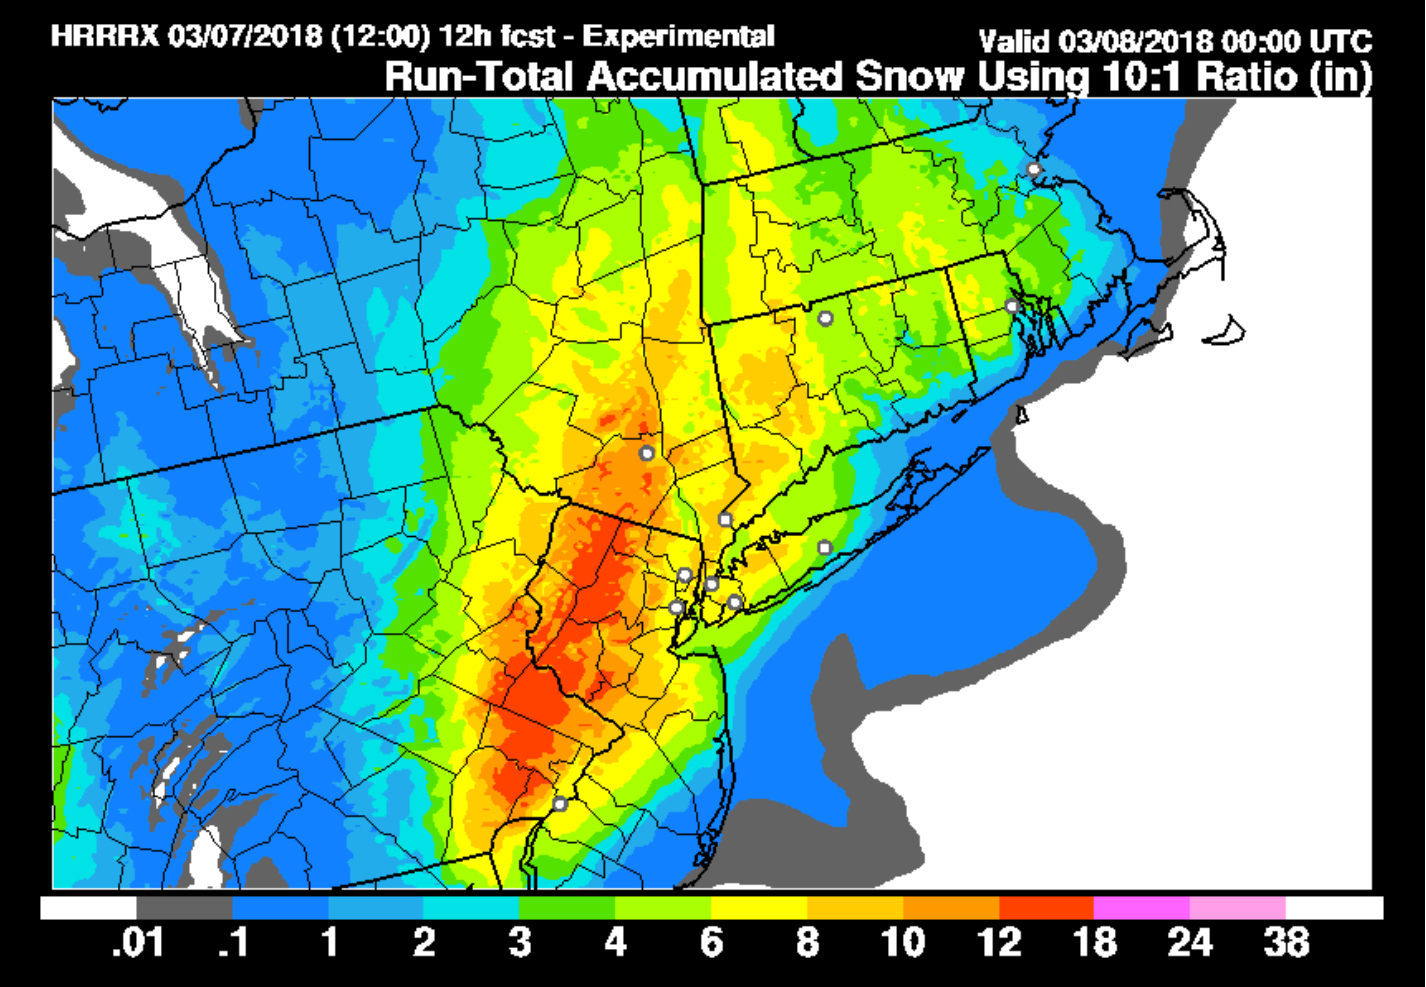
The 00z HRRR (High Resolution Rapid Refresh) shows snow developing between 12 noon and 2 PM Wednesday and ending 7-10 AM Thursday. It will become very WINDY Wednesday night.

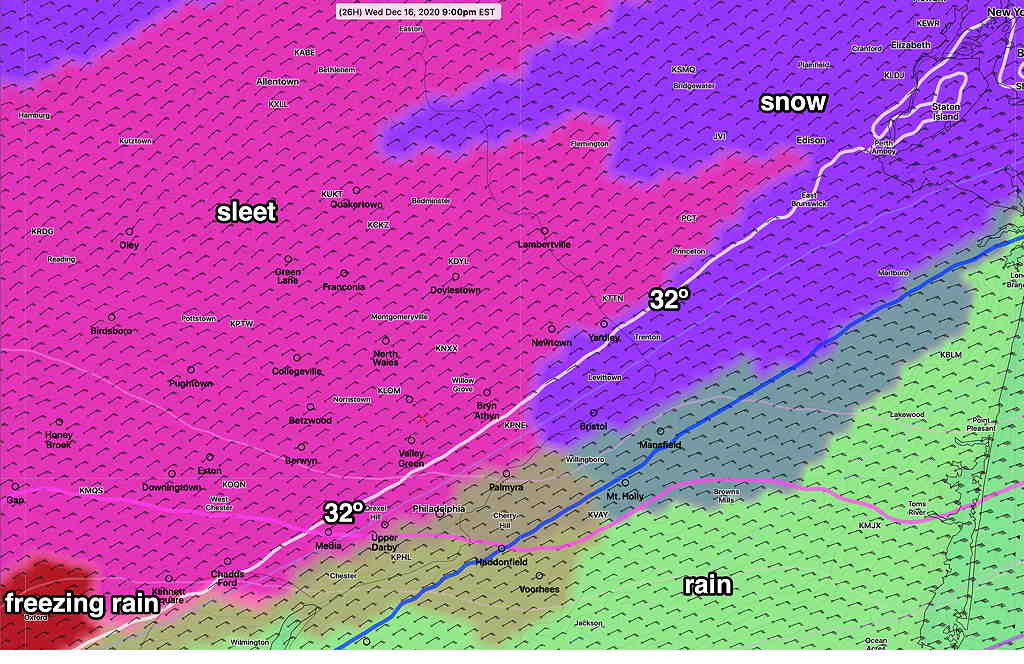
The HRRR continues the trend for sleet to mix in with the snow in a large portion of the area during Wednesday evening, and then change back to snow before ending.

HRRR sleet, rain snow precip type.  9 PM Wednesday  (Click on image for a larger view.)


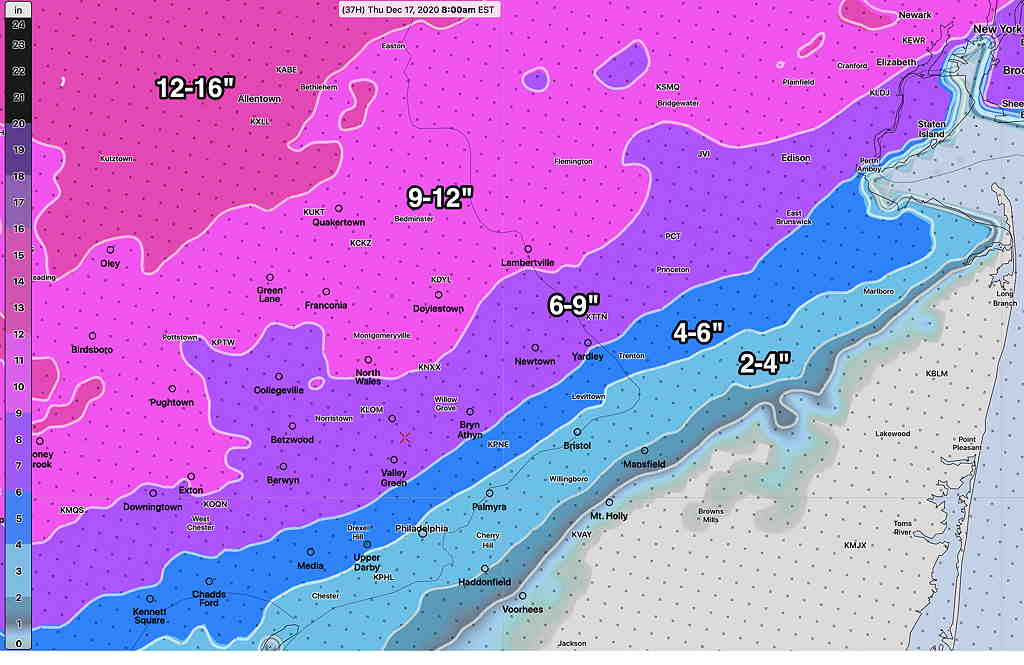
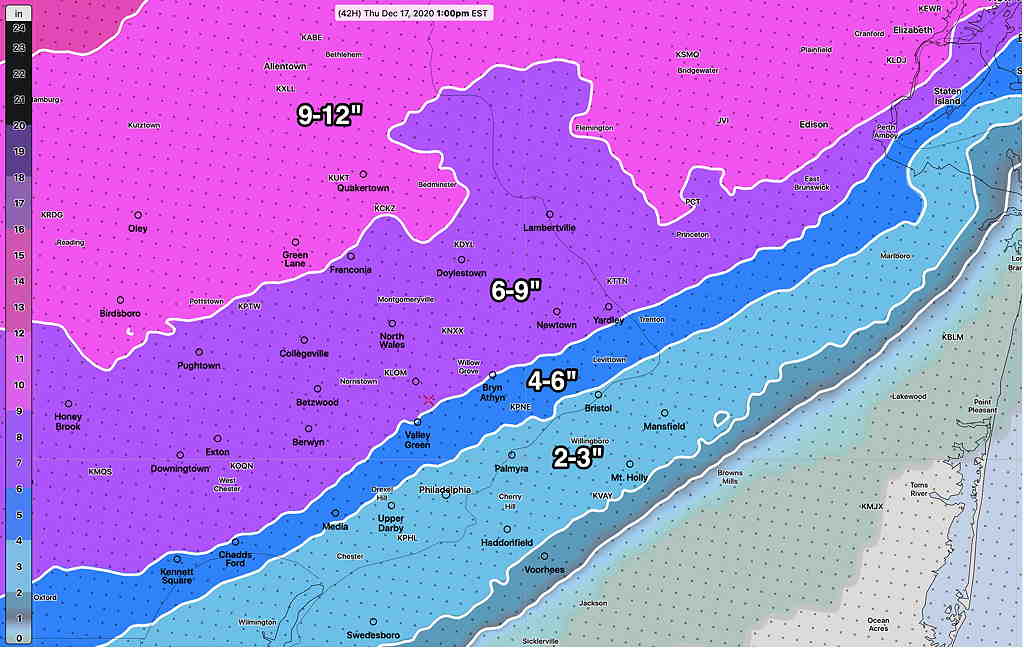
Despite the changeover to sleet at times, the latest HRRR has increased snow totals by Thursday morning—

HRRR snow total forecast  (Click on image for a larger view.)


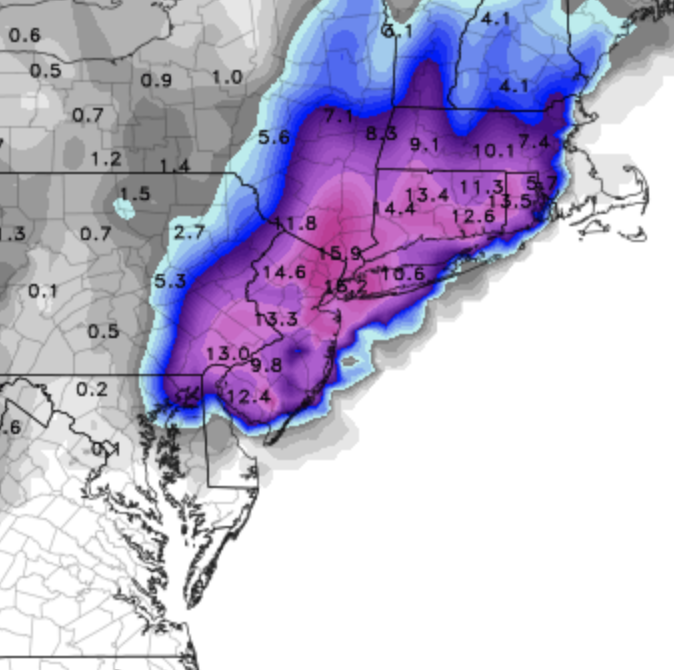
The 00z NBM (Model Blend) shows a similar snow total forecast—

NBM Snow Totals  (Click on image for a larger view.)


Several models are showing wind gusts in excess of 50 mph Wednesday evening.

Speaking of model forecast changes, the NAM NEST just available has more sleet and much less snow

NAM NEST Snow  (Click on image for a larger view.)

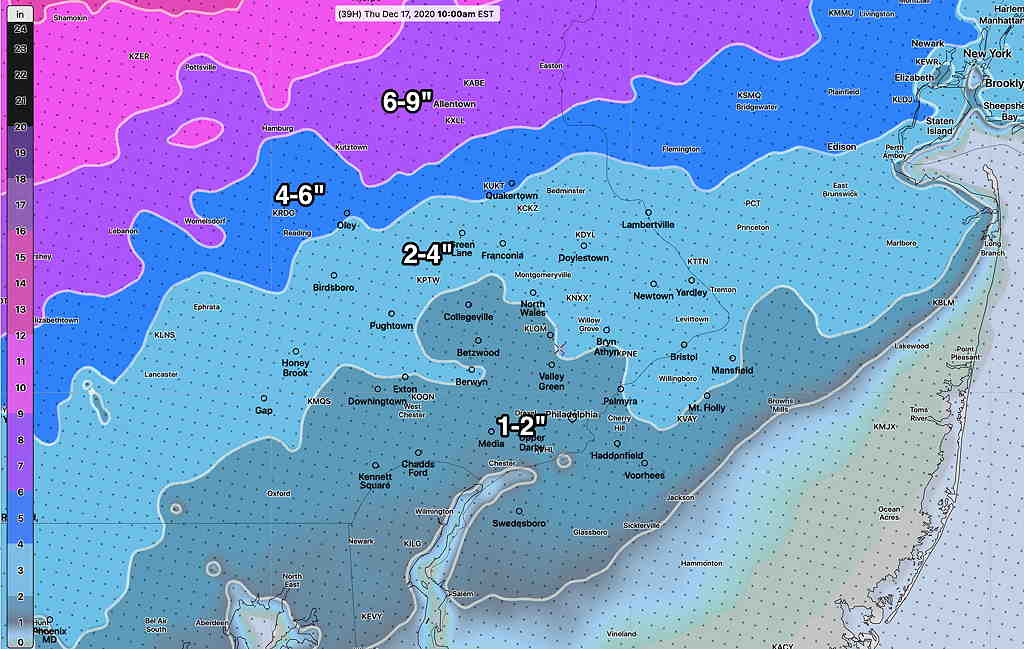
I think the NAM-NEST may be too warm with too much sleet.   We’ll have to see the trends into tomorrow morning.

Right now I’m sticking with the HRRR and NBM snow forecasts above.

SO WHERE’S THE HEAVY SNOW?

Here, just northwest of the city limits, the precipitation has changed to rain with a pause in the action.  A lot has to happen to get to snow totals that the models have forecast!  Perhaps things have been a bit over-forecast?

This morning’s GFS model continues with the same scenario all the models have been forecasting; heavy precipitation with dynamic cooling to allow temperatures to drop and accumulations to occur.

HOWEVER, the GFS Kuchera snow algorithm makes this storm a bust—

Snow totals based on Kuchera
Latest GFS Snow totals based on the Kuchera algorithm!

As mentioned last night, I’m not big on the Kuchera snow algorithm; it tends to seriously underestimate snowfall in past storms.  (Last Friday’s storm had the Kuchera algorithm forecasting NO snow!)

Radar trends show a significant increase in precipitation rates in NJ, rotating westward into Pennsylvania.    Despite all forecast parameters as snow, things have to change soon for this forecast to not be a bust.  And as I type this, precipitation has changed back to snow!  So let’s see what happens.

BTW, here’s the latest HRRR (High Resolution Rapid Refesh) experimental forecast snow totals—

HRRR experimental
Experimental HRRR forecast snow accumulation from 12Z today