
September 1, 2021
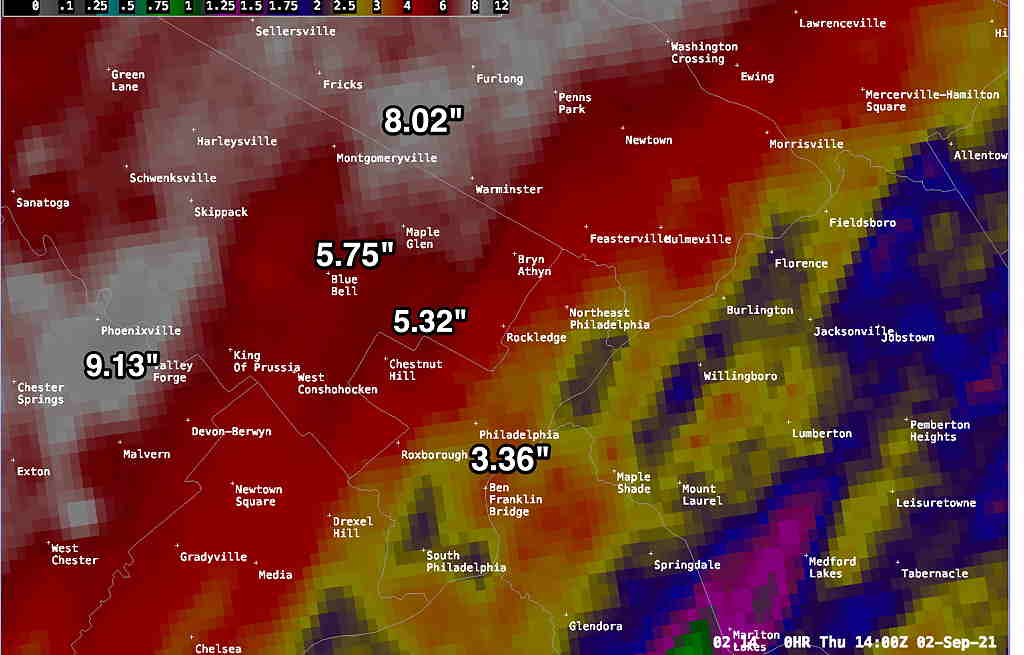
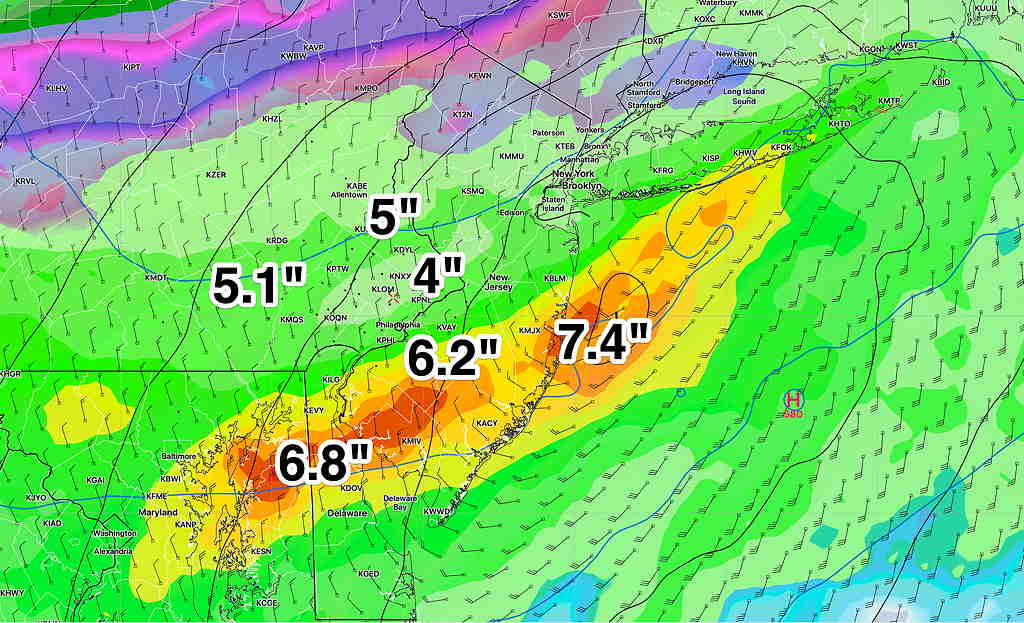
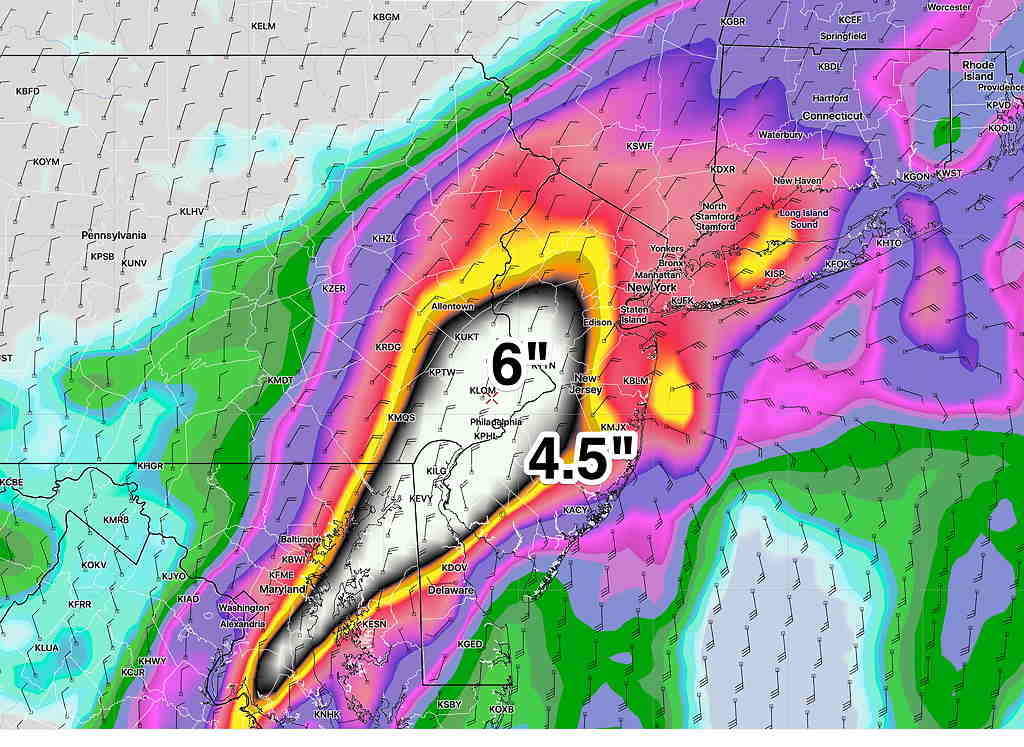
Update Thurs 11 AM— Final MRMS (Mult-Radar/Multi-Sensor System) Rainfall Totals for IDA in the Philadelphia area—
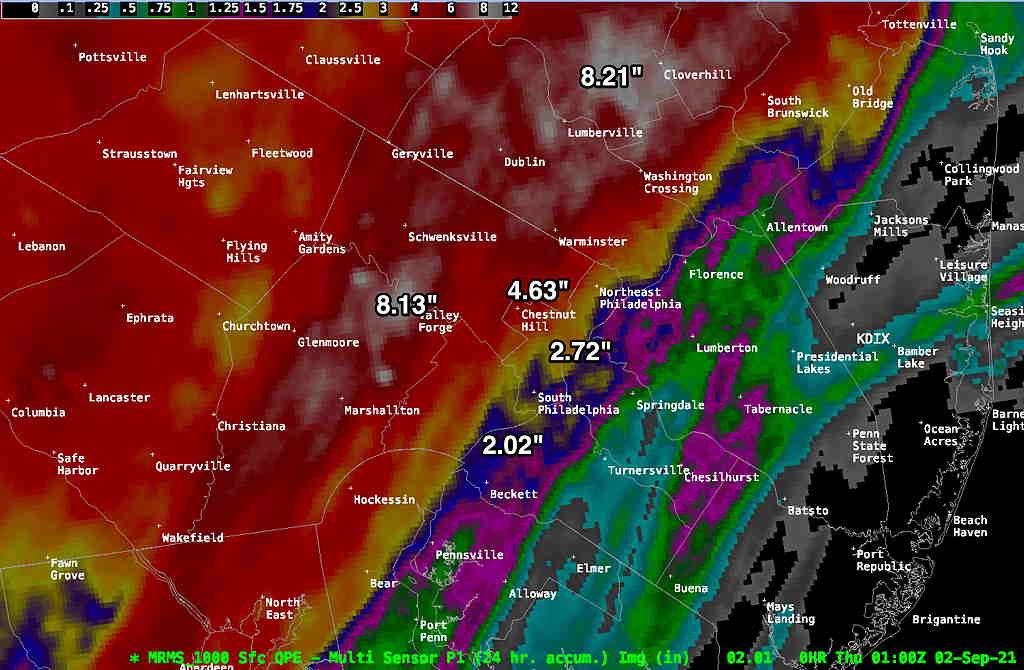
Update Wed 11 PM — MRMS rainfall as of 9 PM-
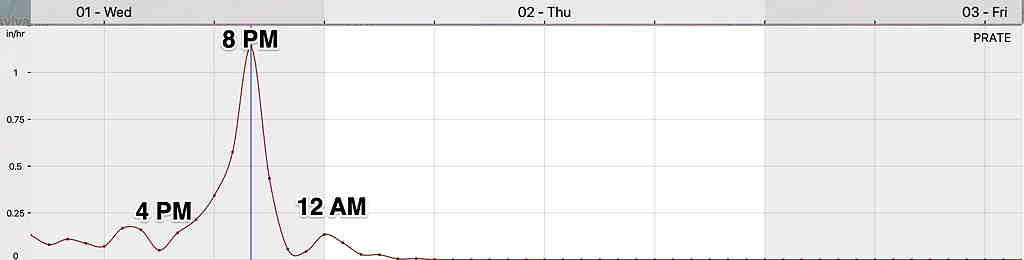
Update Wed 8:45 PM— The hourly RAP model shows the center of what was IDA will be over Philadelphia about midnight. Rain tapers off about 1 AM. And additional 1-2 inches of rain is possible before ending!
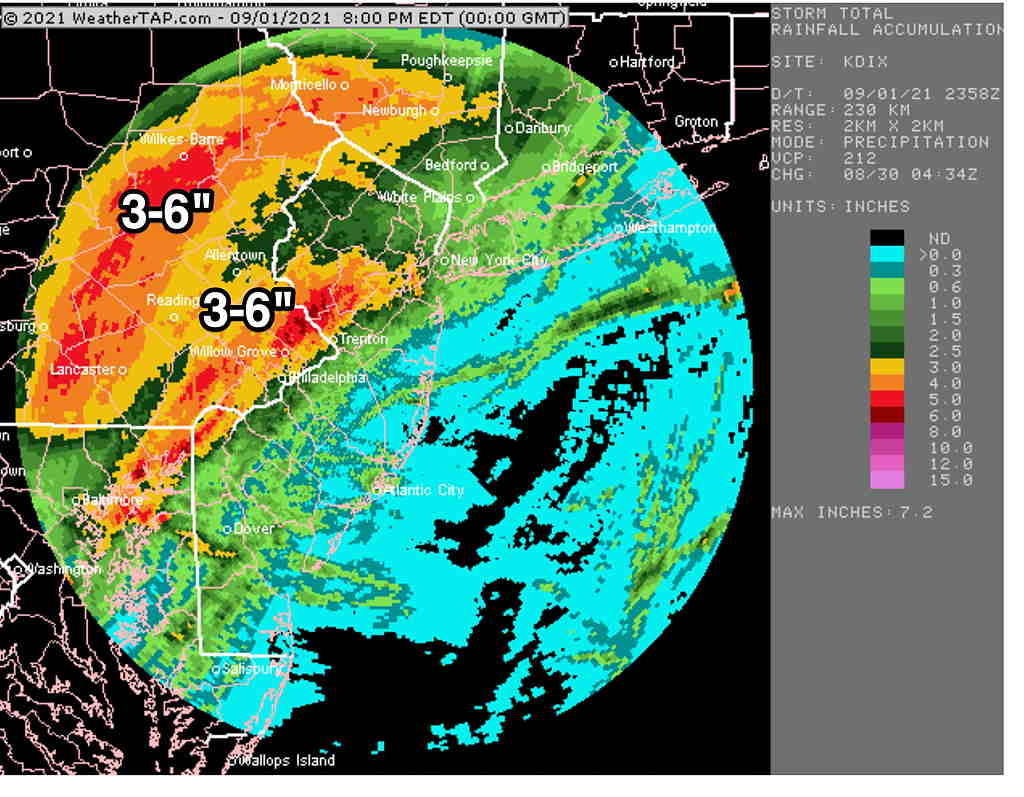
Update Wed 8:13 PM— Total rainfall (radar-estimated) as of 8 PM—
As of 7 PM, here are rainfall totals from the more sophisticated NWS MRMS (Multi-radar Multi-sensor) system combines actual automatic rain gauge data with radar estimates. (note that this is an hour old)—

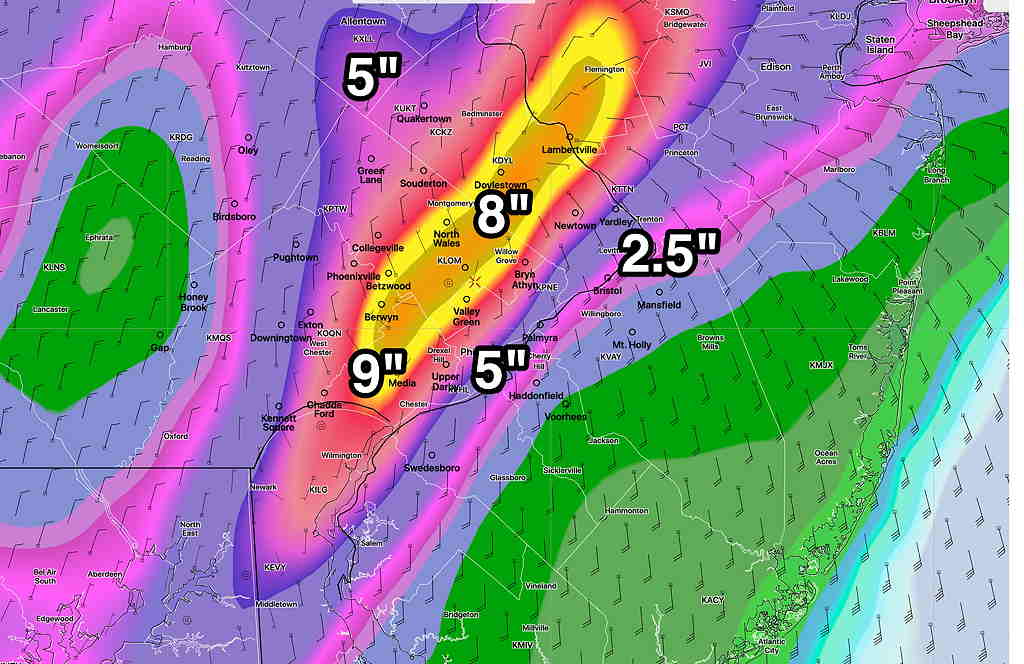
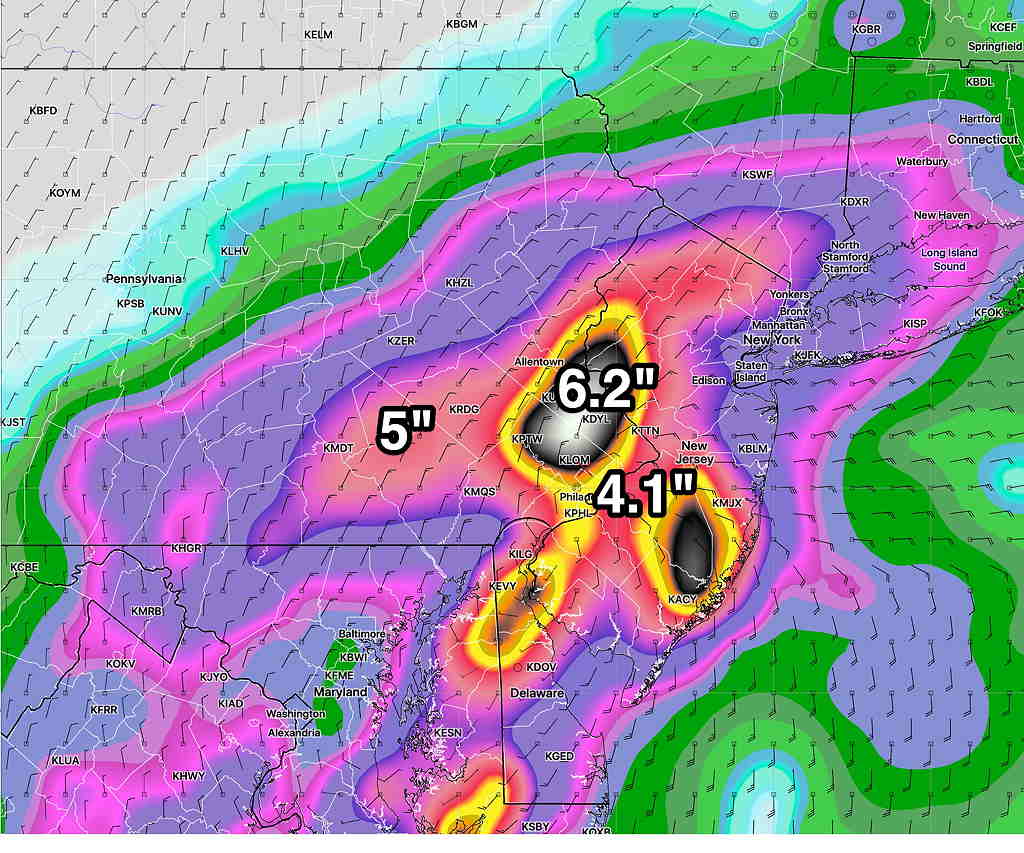
Update Wed 6:46 PM— It appears that the incredible NAM model rainfall amounts shown below are likely to be real. The latest RAP model expands these large amounts eastward.
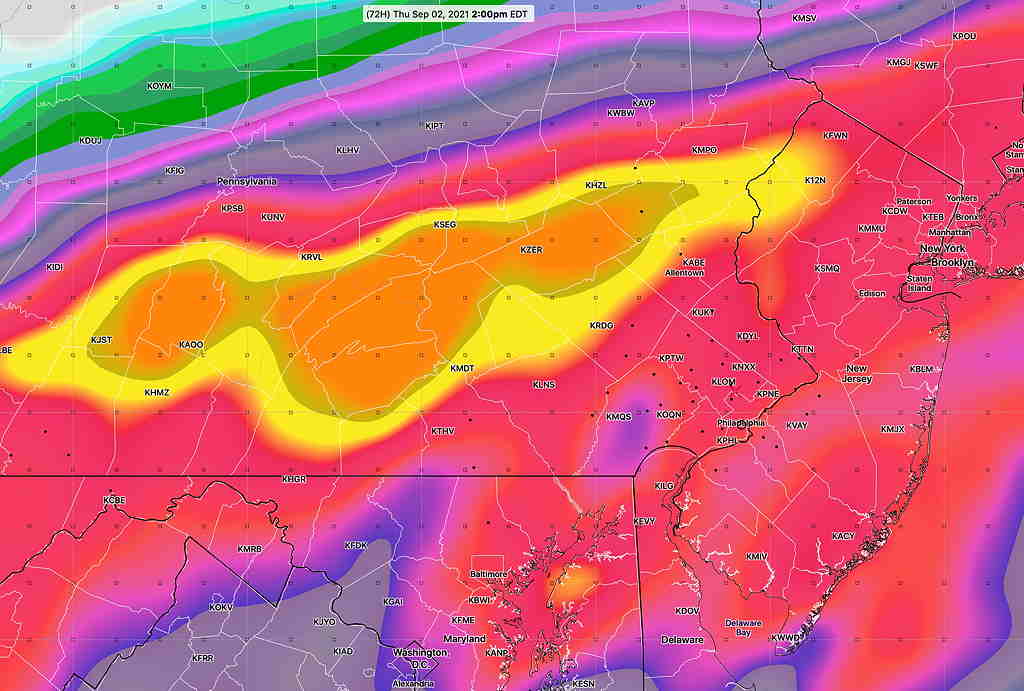
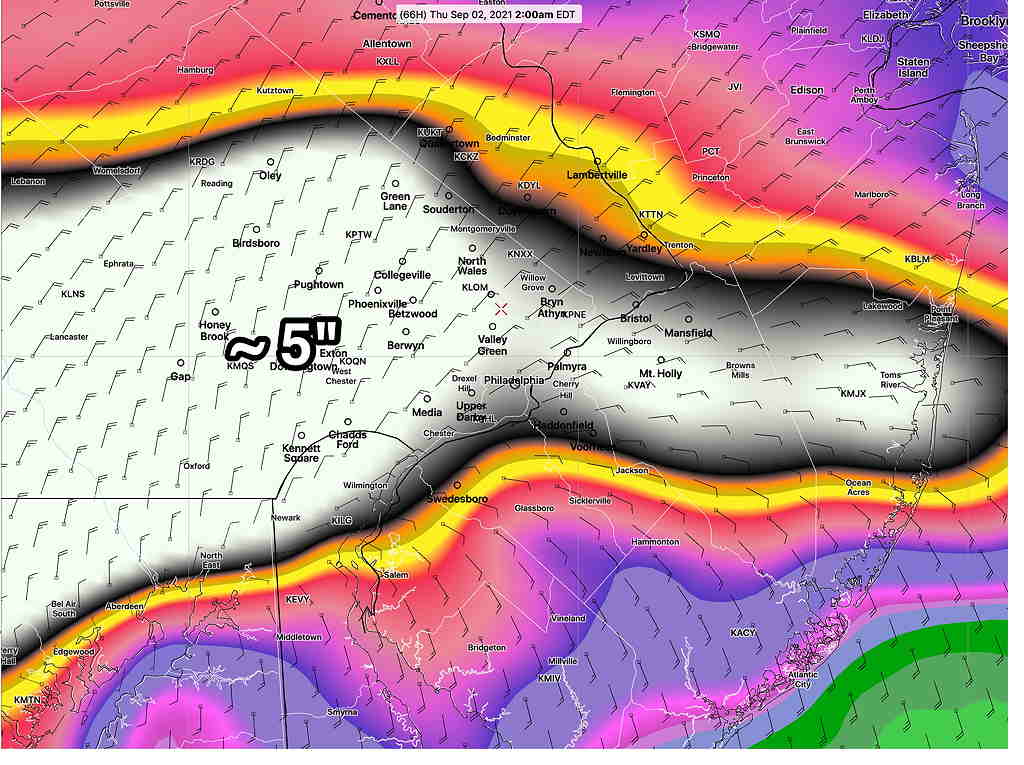
Update Wed 5:20 PM— Some major models are run at 18z (2PM EDT). The latest NAM and HRRR show incredible amounts of rain falling in the Philadelphia area this evening. I’m not sure I believe these numbers. Here is the incredible numbers from the NAM model (2PM thru 2 AM)—
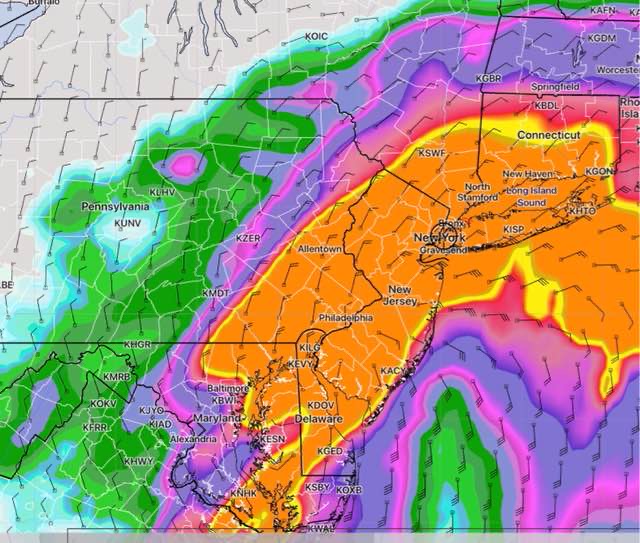
Regarding Tornadic activity, here is the HRRR helicity superimposed on CAPE values. Deeper orange is higher CAPE. Contours are helicity in m/s2 > 500. Likely areas are high CAPE and high helicity (where orange and contours overlap)—
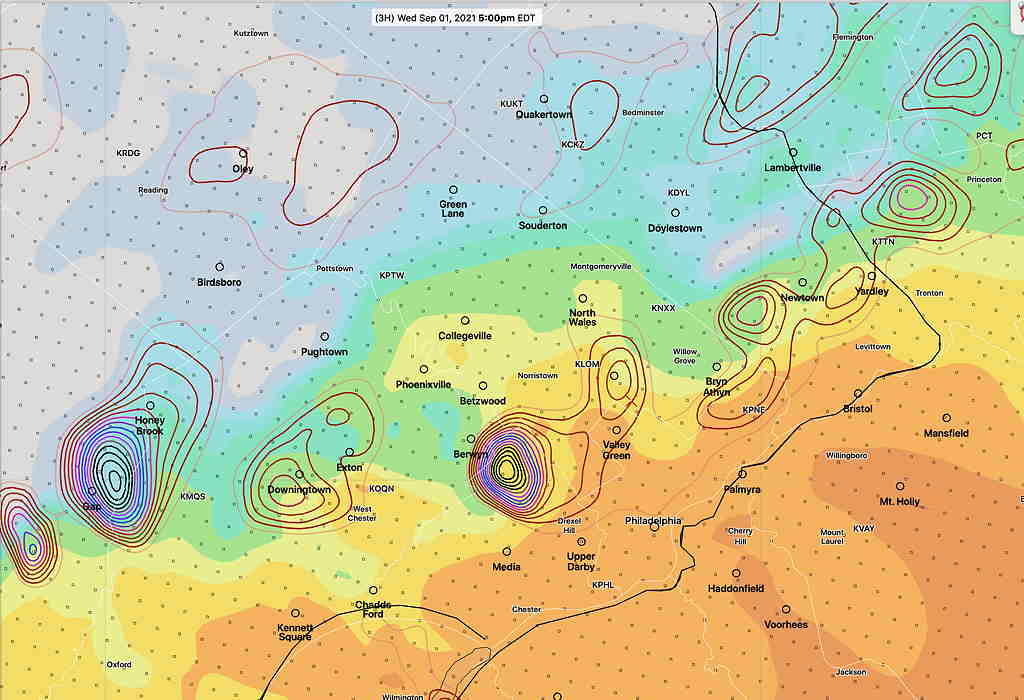
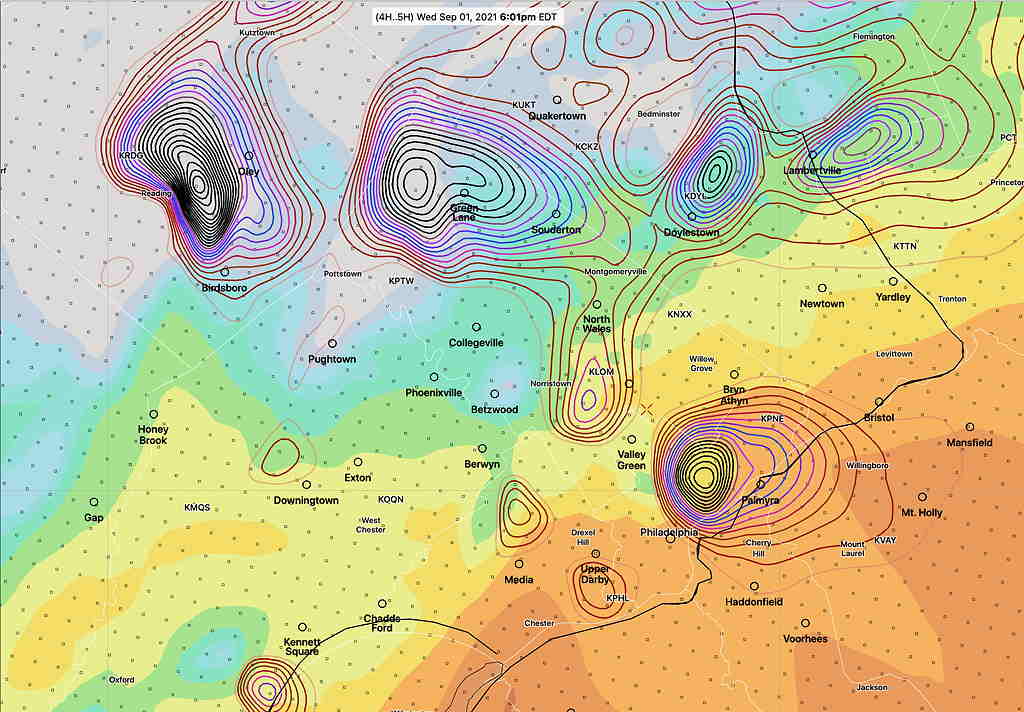
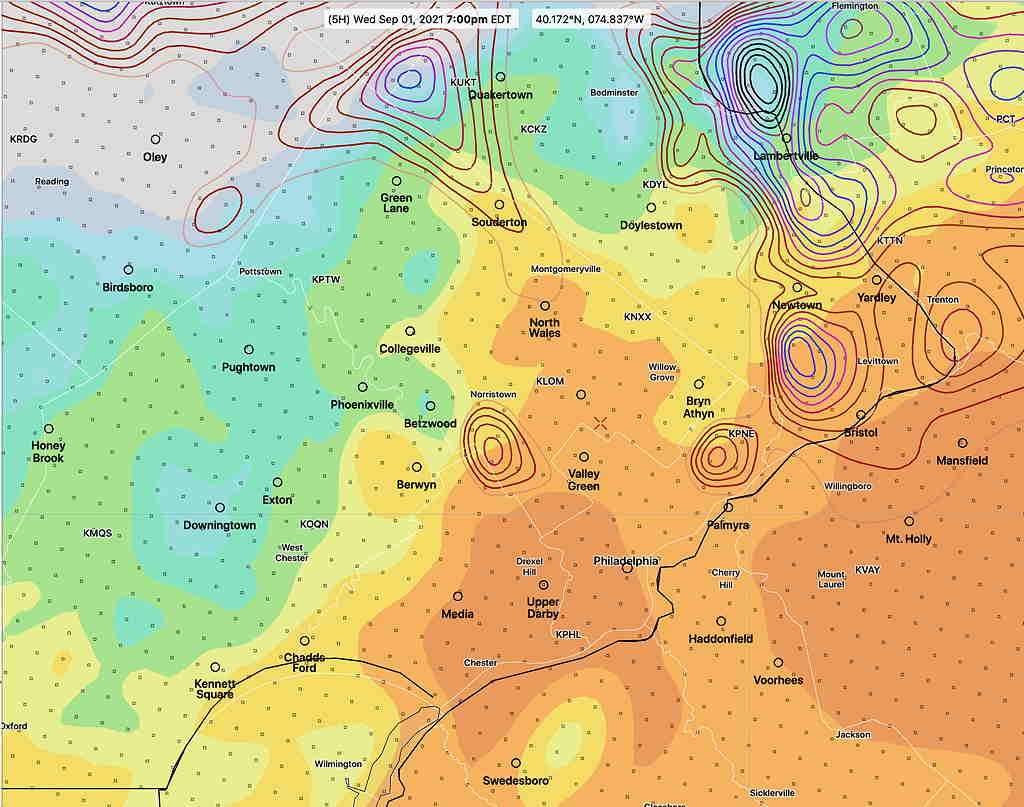
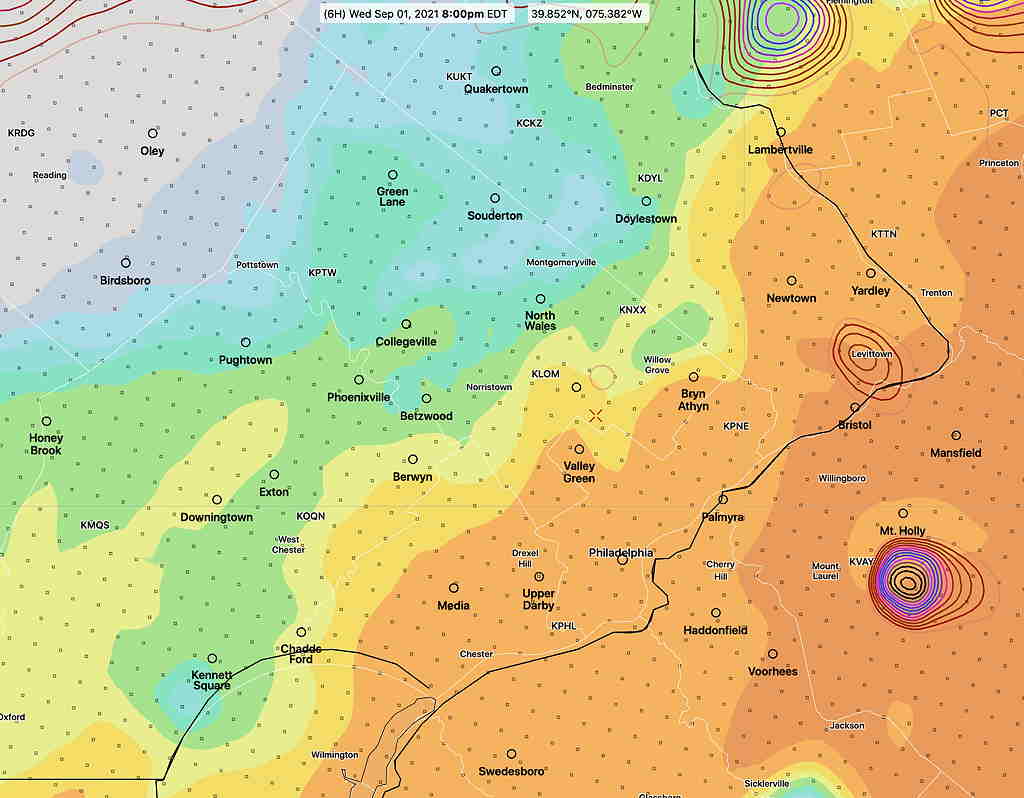
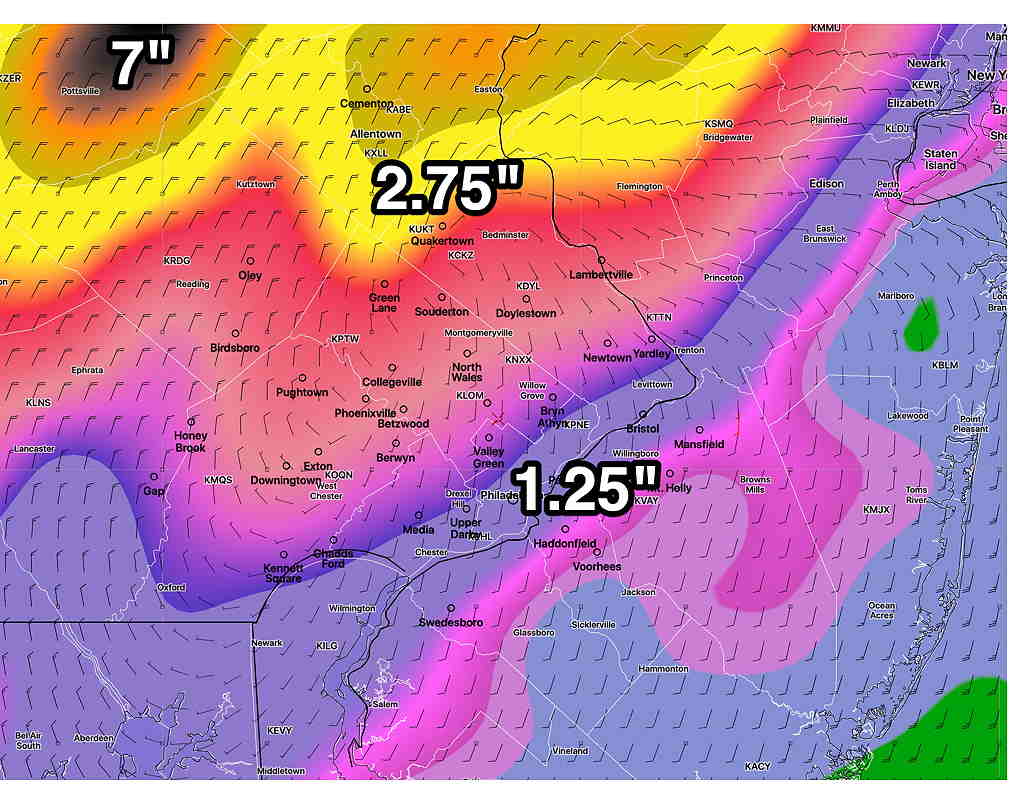
Update Wed 2:05 PM— Latest ICON is similar to the GFS model: “only” 1.5-2 inches in immediate PHL area. Fast gradient to 5+ inches north of Doylestown and near Allentown area. Based on latest RAP model CAPE and Helicity, the best chance of severe tornadic activity is north of Montgomeryville/Doylestown and south of Allentown.
Update Wed 12:35 PM— There are huge differences in this morning’s model forecasts for today. The HRRR maintains the 4 inch total rain for PHL, increasing as one goes northward.
The Canadian GEM maintains the rain maxima from PHL southward and cranks out an incredible 6-8 inches, similar to my posting last night. Still an outlier.
The GFS just available shows only 1.5-3 inches in the immediate PHL area, as does the NBM. I’m waiting for the ICON model new output, available about 2 PM, but the early morning ICON was also in the 1.5-3 inch range for PHL.
As for the severe weather, the ingredients of high CAPE and high helicity don’t seem to come together in the immediate PHL area. The areas near Doylestown might have the right combination for tornadic activity, but areas further north have high helicity but low CAPE. A difficult call. The most likely timing is between 6 PM and 9 PM tonight if anything is going to happen tornado-wise.
Update Wed 6:35 AM— Last night’s models are still forecasting rainfall in the 4 inch range in PHL and more northward. One thing we do know now…there’s more rain falling at this time in the morning in PHL than had been predicted. Not sure how that bodes for the rest of the forecast.
Update Tues 10:15 PM— Tonight’s NBM model has incorporated the Canadian GEM and the other afternoon models with a generalized 4 inch rainfall for the immediate Phladelphia area with much higher amounts towards Allentown. The steep gradient in total rainfall in northern areas still exists. Any thunderstorms may result in localized heavier amounts.
Of interest is tonight’s high resolution model, the HRRR, which shows the possibility of severe thunderstorms and even tornadic activity, especially after 8 PM, when CAPE and especially helicity values become highly elevated. Most likely areas are in the northern and far northern suburbs. The HRRR also shows wind gusts of over 40-50 mph with these storms.
As mentioned in the earliest post in this series, the extreme rainfall amounts being forecast are the result of this tropical system interacting with a developing upper air trough and an upper air jet streak.
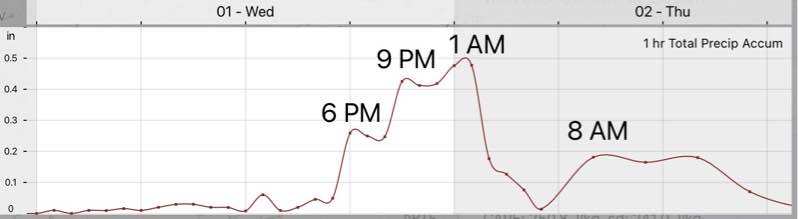
Here’s the current meteogram for Blue Bell showing that the heaviest rain begins about 5- 6 PM.
Update Tues 6:30 PM— Just sharing a likely ‘outlier” model- the Canadian GEM, which has consistently forecast an area of convective storms (thunderstorms) just south of the immediate PHL area. This high convective forecast pushes the GEM’s rain maxima to our south. I don’t think it’s correct, but I’m presenting it as food for thought—
My bet is with the ICON model forecast just below.
Update Tue 5:40 PM— This afternoon’s models just becoming available. I wanted to share the latest ICON model rain accumulation forecast which is in line with the ~ 2 inches (immediate PHL area) from the this morning’s NAM and GFS. The ICON model did very well with last year’s tropical storms.
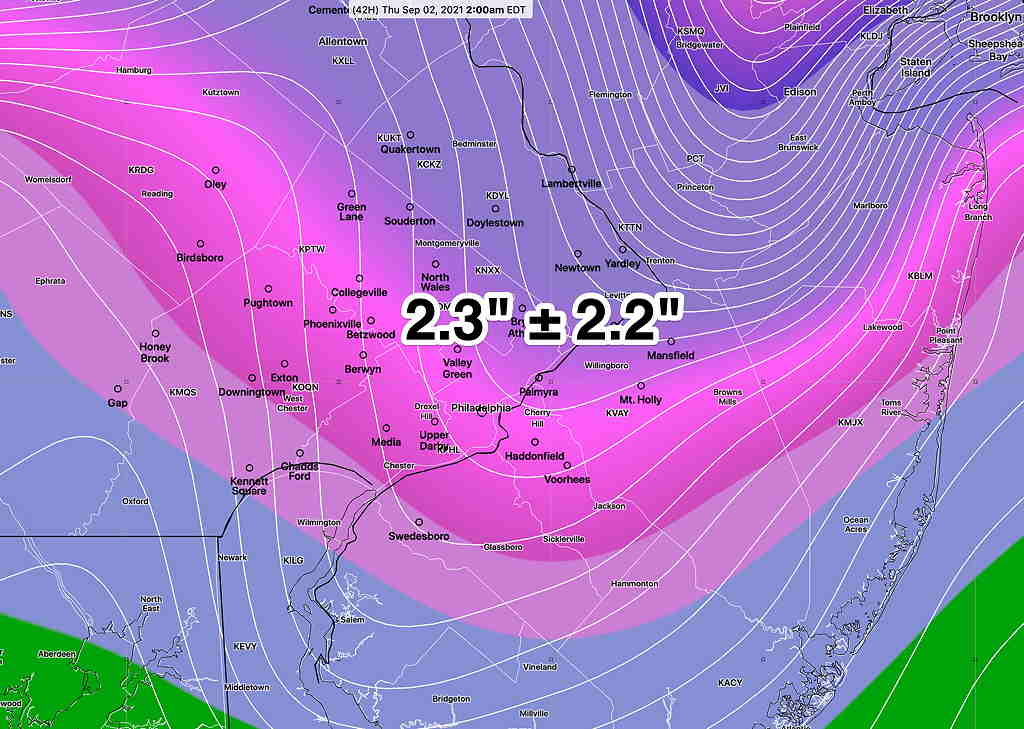
Also of interest is the very latest GEFS statistical ensemble model, specifically what is called the “GEFS bias-corrected” model. It also shows the same general range, but the standard deviation is almost as large as the mean value.
I have limited access to the European Model (ECMWF) data. The ECMWF is similar to the ICON above.
Update Tue 12:20 PM — A quick mobile update. This morning’s models have backed off on the heaviest rain for the immediate Philadelphia area. Totals under 2 inches expected, heaviest far northwest.
Update Tue 9:19 AM— Based on last night’s models, here are the current trends: Most models have come closer together in their placement of the heaviest rains. The latest GFS has increased the rainfall in our area in the range of 4-6″ of rain, in line with the NAM model runs of the past day. The ICON model is similar with closer to 3-4″ of rain in our neck of the woods.
These are flooding-type rain amounts. With winds gusting to 30+ mph at times, a potentially dangerous storm for our area.
The timing is somewhat earlier for the heaviest rain—
Update Mon 7:20 PM— Today’s models continue with a range of rain accumulations; the GFS continues with more rain to our far northwest—
The Canadian models have the heaviest rain to our south in Delaware and Maryland. (I’m not impressed with the Canadian model’s handling of precipitation placement with tropical systems.)
The most recent NAM and ICON are somewhat similar to the GFS above.
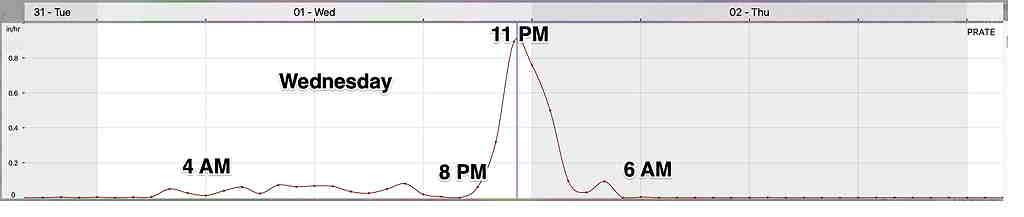
Of most interest is the shift in timing of the heaviest rain. Most models including the model blend (NBM) have the heaviest rain falling before midnight on Wednesday. Here’s the latest GFS meteogram for something called the PRATE (hourly rate of precipitation) between 10 PM and midnight.
Update Mon 12:40 PM— A quick look at the latest models just becoming available. The heaviest rain is now coming Wednesday afternoon and evening and night, a shift towards a later arrival of the storm.
The NAM maintains at least 5″ of rain in much of our area—
The latest GFS has shifted the rain maximum to our very far north and west and is in line with the 06z ICON model —
The latest Canadian GEM model has the extremely heavy rain mostly in southern Delaware.
So there’s uncertainty at this time regarding the area to receive the heaviest rain. I’m waiting for the latest COAMPS model on the track of the storm.
Update Sun 10:50 PM— The latest NAM model just available shows a generalized 6-8 inches of rain from Ida beginning early Wednesday morning and ending Thursday morning.
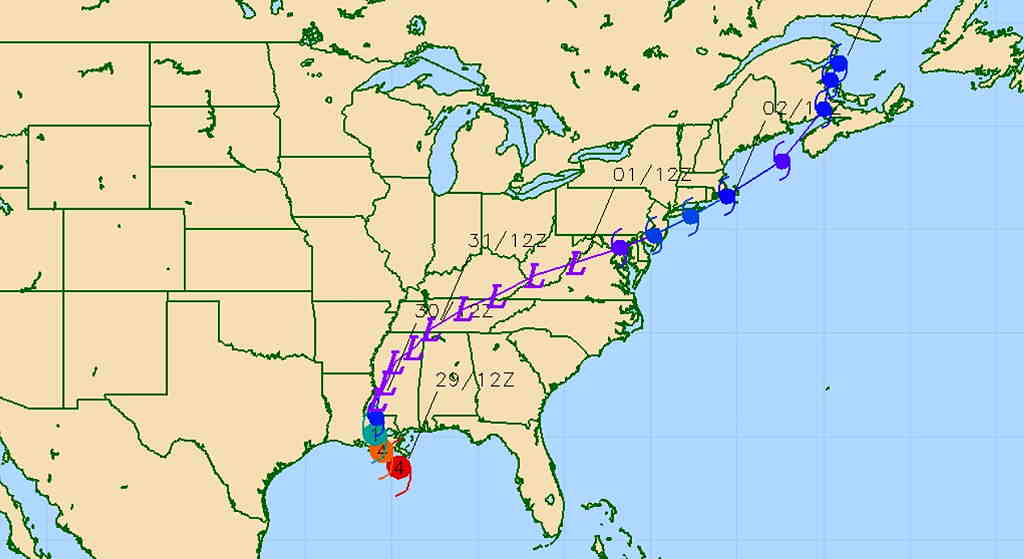
Hurricane Ida is impacting Louisiana as I post this message Sunday evening as a Category 4 storm.
The eventual track of the remnants of Ida has been consistently forecast to move up over our area on Wednesday. The US NAVY COAMPS model has done a great job with the timing and position of the storm.
The latest available COAMPS takes the storm remnants just south of the Philadelphia metro area on Wednesday, indeed, it actually shows it re-intensifying into a tropical-structured system as it get closer to our area—
The reason for the tropical intensification in our area is likely due to its interaction with a developing upper level trough expected to form over the northeastern US.
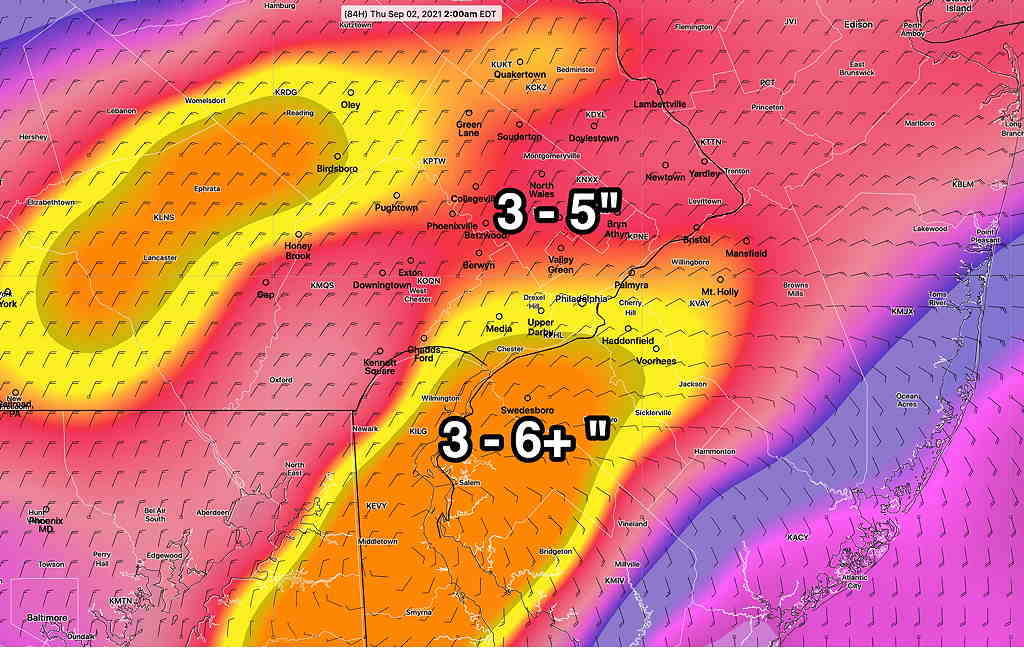
Extremely heavy rainfall from 3-6+ inches are expected from this system in our general area from Wednesday into Thursday.
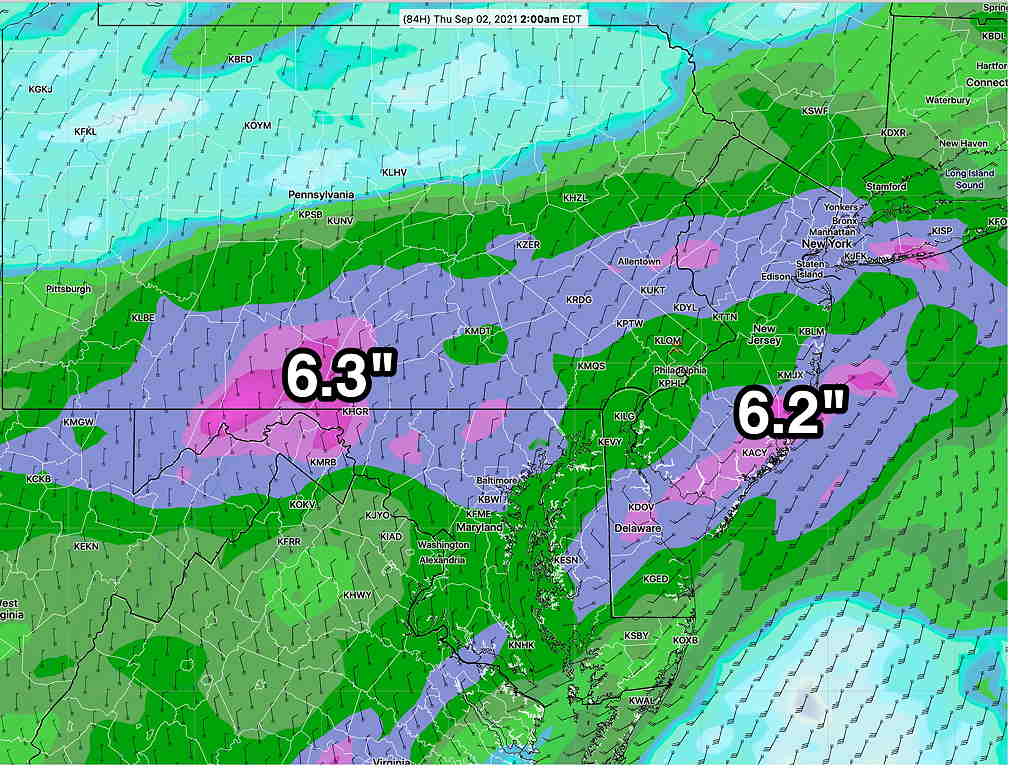
Here’s the latest GFS model accumulated rain forecast for Wednesday as of Thursday 2 AM—
Prior to today, the track of the heaviest rain was in central Pennsylvania. The latest ICON model still shows this track—
The latest Canadian GEM model through Thursday at 2 AM has a different placement of the heaviest rain —
The take-away from all this is that’s too soon to know the exact placement of the heaviest rains from Ida in our area, but expect heavy rain, likely within the range of the current GFS and ICON models. Stay tuned.
Hey, Weatherguy. If you get a chance to do another update before all hell breaks loose, could you take a look at tornadic risk for the greater PHL area? I’ve read four reports this morning and gotten five opinions from them, so nerves are running high. It’d be nice to have your nuanced analysis of the situation.
As always thanks for the superior reporting!
I’ve updated the website and addressed your question.
Thanks for the CAPE/helicity maps; can’t thank you enough for that info. Been way too interesting this evening. Didn’t realize SE PA had been traded to Oklahoma.
Stay safe.
This has been a memorable weather event. More rain here than any model forecast. Much more convection (thunderstorms) and tornadoes although last night’s Canadian GEM was closer to the reality of things. My favorite, the ICON, has done very poorly. Thanks for your comments of appreciation.