Tag Archives: Jet Stream

THOUGHTS: WARM WEATHER IN DECEMBER & JET STREAMS

Updated with graphic below.

This week’s weather is expected to be influenced by a flat to ridge-shaped jet flow.

I know the TV weather people like to talk about the jet stream as something that has a mind of its own. They talk about changes in the jet stream as something that just changes, without any apparent reason.

Frankly, I don’t think that is all that accurate nor is it conceptually useful.

What makes more sense to me is that the jet stream winds flow confined to the three dimensional valley created between the bulges of the two major air masses. The position of the jet stream and its configuration takes on the shape of the edge of the air masses and the valley between them.

GEFS forecast jet wind speed and position (300 mb level) for this Thursday. Air mass 1 and Air mass 2 have their own circulations. Between the two air masses bulges is a valley where the the jet stream flows. Conceptually, it makes more sense to think of the jet flow shape and position as influenced by the size of the relative air masses and their individual shape. Speed ups (“jet streaks”) and slow downs in the jet flow are result of constrictions and widening between the air masses. I have intentionally drawn air mass 1 smaller than the tropical air mass 2.

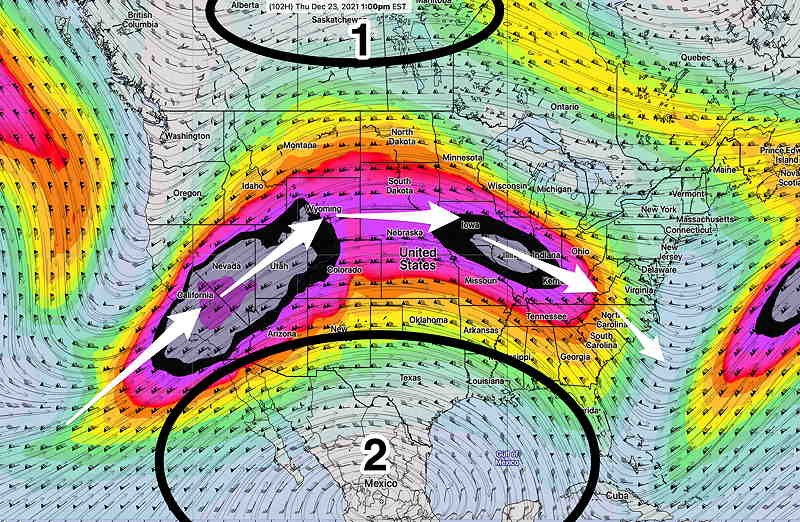
Localized increases in speed of the jet stream (called ‘jet streaks’) are related to narrowing of the valleys between the air masses, just as a garden hose nozzle creates a water jet of increased velocity.

(Indeed, the the name jet stream has little to do with jet airplanes. The stream of air comprising the jet stream displays the physics of “jets” in the field of fluid mechanics, as in the garden hose reference above.)

The movements, size, temperature and densities of the main air masses on the spinning earth determine the changes in the jet wind shape and position. While there certainly is a feedback mechanism where the jet flow reciprocally affects the air mass shape, conceptually, I feel this leads to a poorer grasp of the main determinants of jet stream position and shape.

So why am I talking about this today?

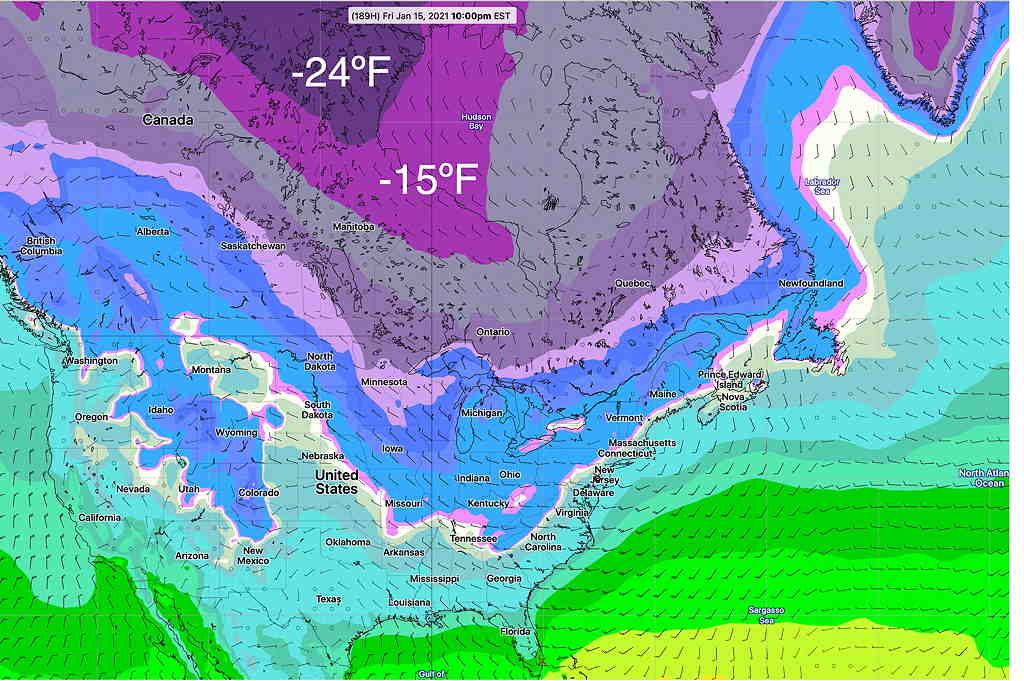
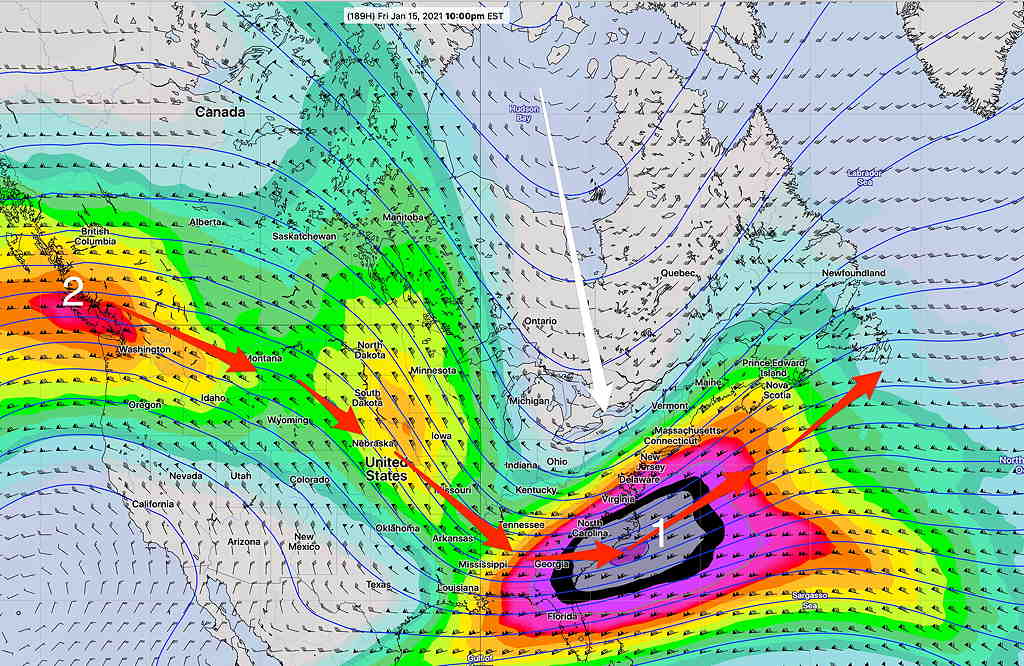
Well, the position of the jet flow this week with its northern position (for December) and bulge northward is the result of the the tropical warm air mass (2 above) being larger than the current colder denser polar air mass to the north (1 above.) Simplistically, there isn’t a larger or dense enough cold air mass to displace the very large warm tropical air mass to the south.

Why is the tropical air mass so warm? Well maybe the ocean surface temperatures, warmed by the atmosphere are maintaining their heat.

Global Sea Surface Temperature anomalies. Things are looking pretty warm out there! (Click on image for a larger view.)

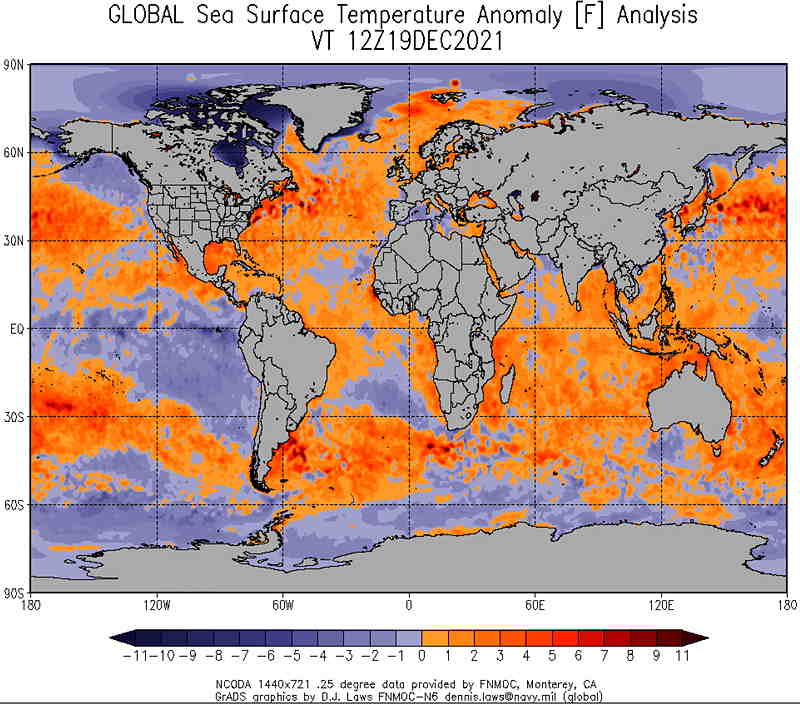
People talk about climate change and global warming. This is one of the ways it manifests itself.

Eventually, very dense cold air to our north will accumulate enough that it will bulge downward and push the jet stream position to our south. How the cold air slides down and its shape will determine the new valley position and the new jet stream configuration.

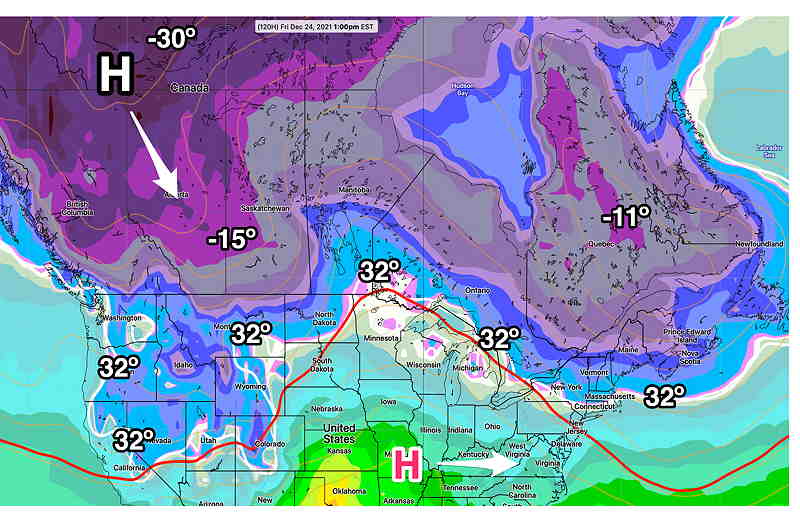
There is some evidence that a pattern change may be setting up, with cold air pooling in far northwestern Canada by Christmas eve. Following a very mild upcoming Christmas weekend, the final week of this year and the first week in January may be positioning itself for a pattern change

ICON model forecast for this Friday. Cold air pooling in Canada suggests a movement southeastward, pushing the jet into a more winter-like position by the very end of December. (Click on image for a larger view.)

SO WHERE’S THE SNOW?

I should preface this post by saying that I enjoy trying to predict snow rather than dealing with it after it has fallen. Pretty when it falls, a pain afterwards.

That said, I’m being asked, ‘ so where’s the snow?’

I’ve mentioned since the end of November that my sense of the weather pattern so far this winter is what I like to call “a lack of very cold air” to our north.

Here’s the current GFS statistical ensemble forecast (GEFS average) expected minimum temperatures for next week—

GEFS statistical average minimum temperature forecast for next Friday.  (Click on image for a larger view.)

Well, maybe you’re thinking, -24ºF seems awfully cold to me? The truth is, when things get going, temperatures are as low as -40º to -50º in the same areas above, especially in Greenland. (Greenland is looking awfully warm this year.)

Contrary to what many weather entertainers on TV seem to suggest, the jet stream doesn’t just do it’s own, arbitrary thing. The jet stream, a fast flow of winds at about 35,000 to 40,000 feet in winter, is a river of air actually flowing in the three dimensional “valley” between air masses.

It is the density and shape of the cold air mass that determines the shape of the valley and of the jet, not the other way around. In essence, the jet flow shape in winter depends on the “sag” of very cold moving southward, as depicted below with the white line—

GEFS forecast Jet Flow (300 mb winds) next Friday (Click on image for a larger view.)


Notice that the white line is tilted slightly eastward instead of straight southward.  The relatively “not so cold air” up north doesn’t have the mass density to dive straight south.     The jet stream flow (red arrows) isn’t suppressed directly southward, but rather southeastward.  

There also hasn’t been much of a blocking effect of a large cold air mass over Greenland and the Northern Atlantic to cause the same jet flow to bend back north up the coastline. 

As a result the two “jet streak” impulses (numbers 1 and 2 above) develop low pressure systems, but these move out to sea.  

So we need colder air in Canada, and colder air in Greenland and the North Atlantic.

The time period depicted above (January 15th-20th)  does show some positive trends towards snow here:

  • Temperatures are colder in Canada than they’ve been.
  • The jet flow next week will be “less split” than it’s been.   It does appear that some phasing may occur between the northern jet flow shown (disturbance #1 above) and the southern jet flow (just visible on the map from Mexico and near #1)

So, some colder temperatures and some action is possible January 15th – January 20th, although not currently captured on the models.  Stay tuned