FYI: The newer model runs of the major global models, the GEFS, CMC, and the ECMWF don’t become available until well after midnight. (The GFS model data for this forecast time frame becomes available about 11:10. ) Your favorite TV weather entertainer won’t have any meaningful updated forecast information this evening.
I’ll update tomorrow morning.
BTW, I saw this interesting article in the Washington Post.
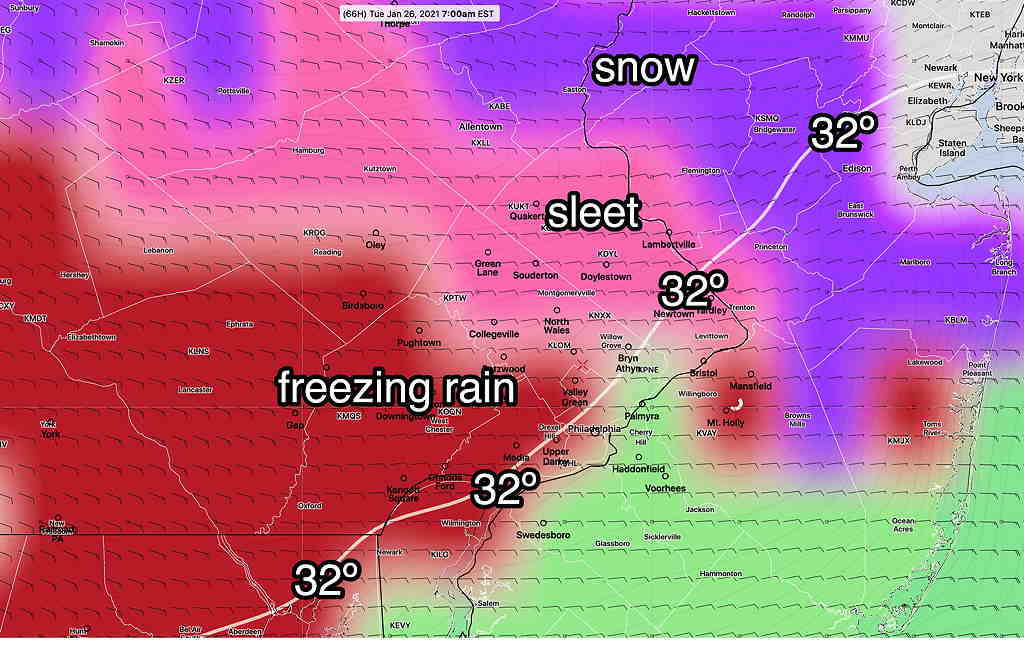
from earlier…
Cold air has built up in Canada and it will make its plunge into the eastern US over the next few days resulting in an amplified jet stream.
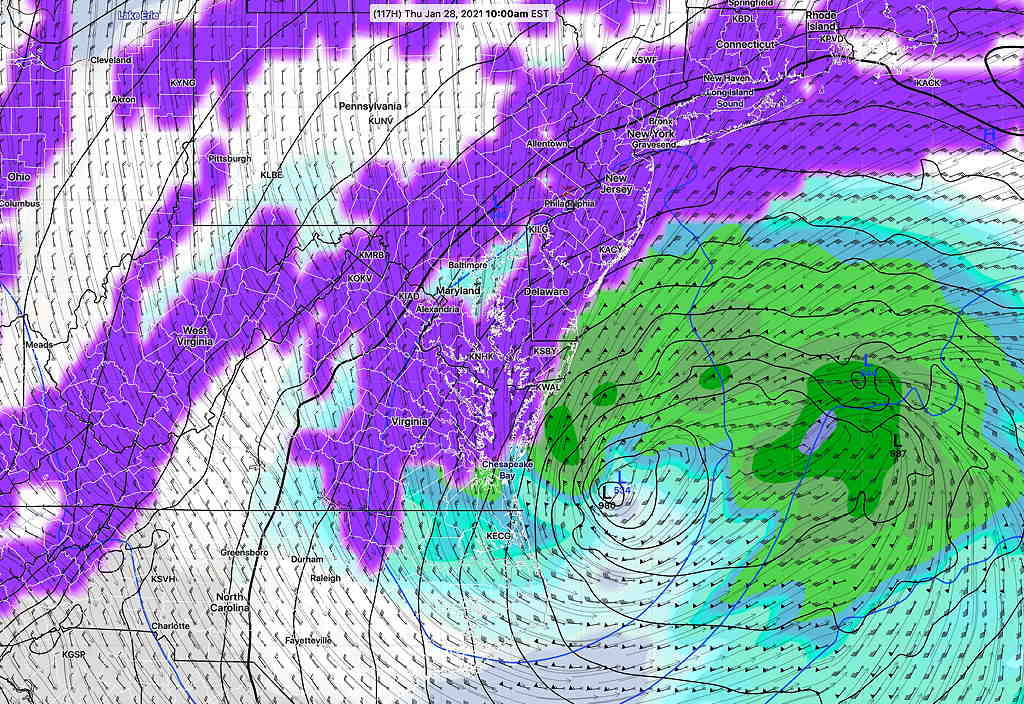
After several frigid days through Saturday, low pressure in the Midwest will try to bring warm air and moisture over us aloft (basically a warm front) on Sunday. This should result in snow for us some time on Sunday afternoon or evening. These scenarios (warm advection snows) can produce an inch or two of snow, sometimes more.
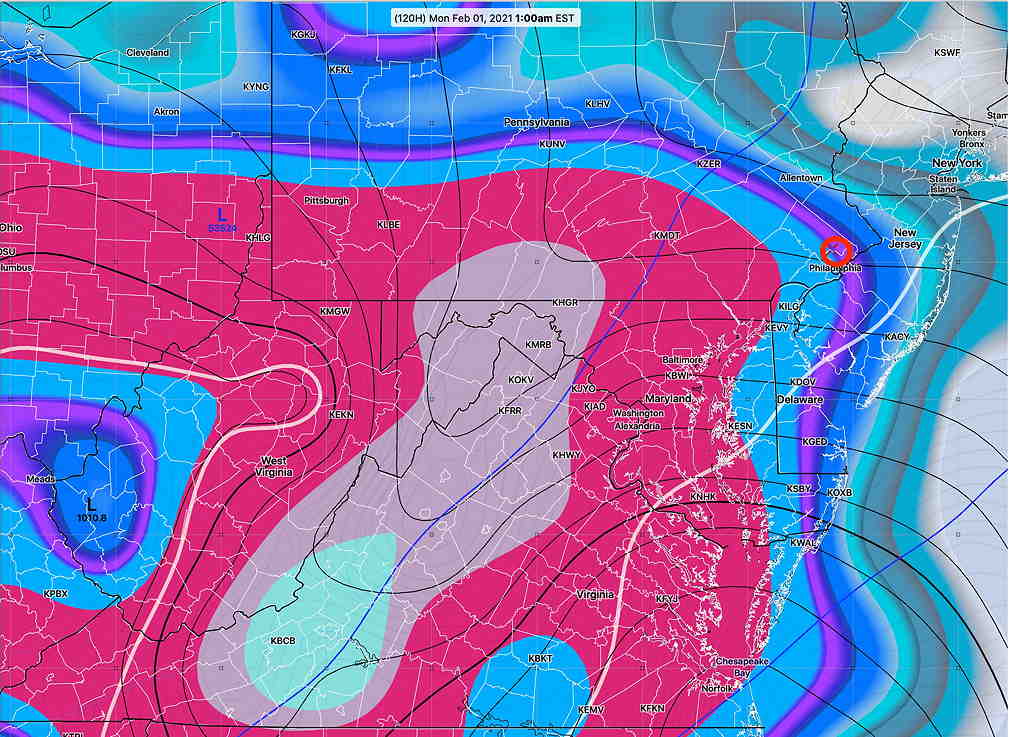
Of interest, several models have this Midwest low pressure system spawning a secondary coastal low late Sunday night—
Depending upon the exact location of this secondary low, we could get additional snow. Right now, the dip in the jet flow does NOT show an ideal track for development needed for heavy snow in our immediate area—
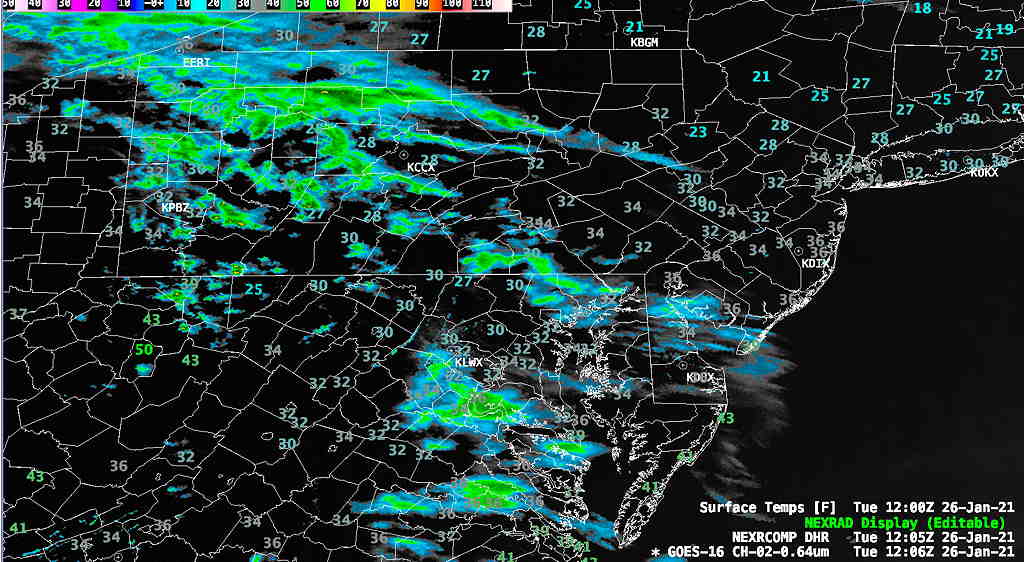
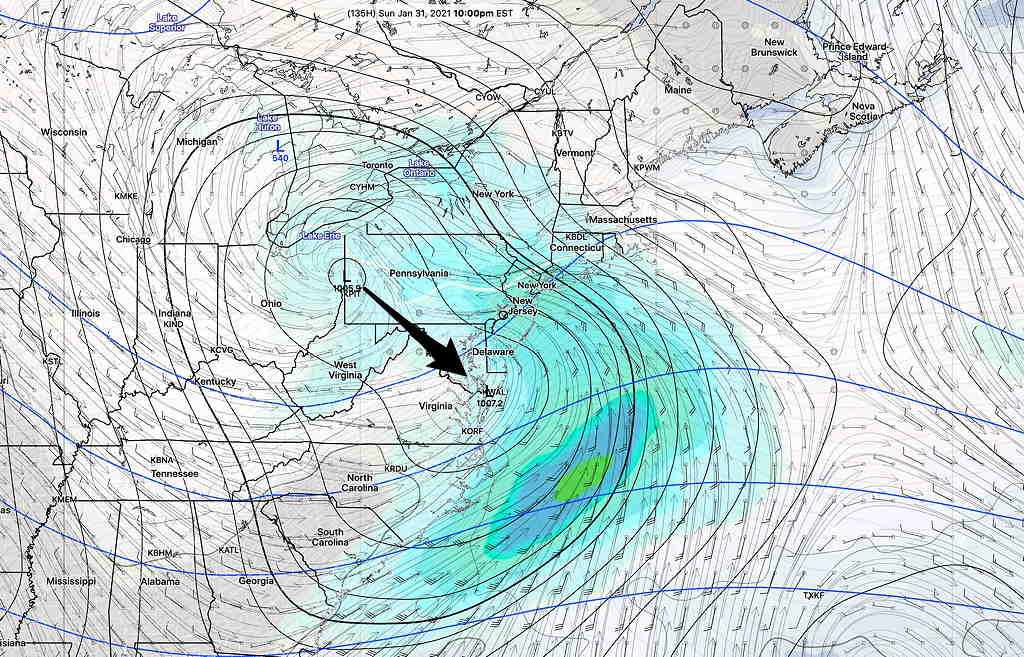
As we saw with today’s system, model storm forecasts several days in advance can easily change. (The southward impulse (white arrow) could phase more, causing a sharper bend in the flow.) This one looks like it has potential, but the trend over the past day has been for a more eastward track.
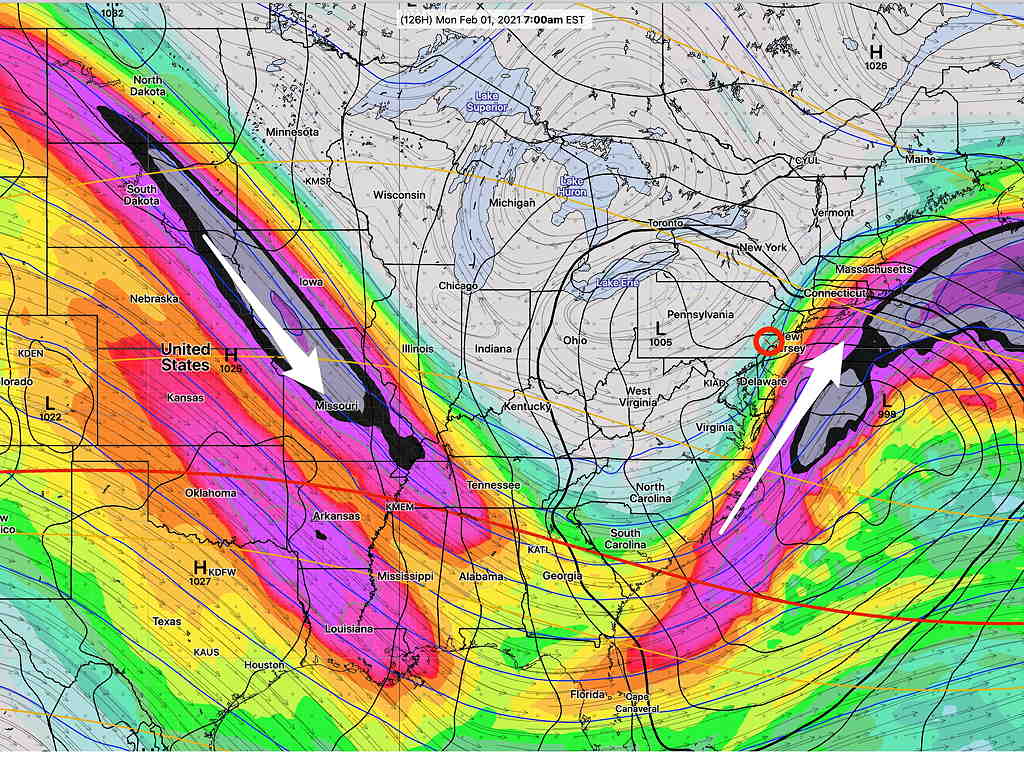
However, of interest is the German ICON model whose current forecast extends to 120 hours (Monday 1 AM). It has very heavy snow tracking just south of our area late Sunday—
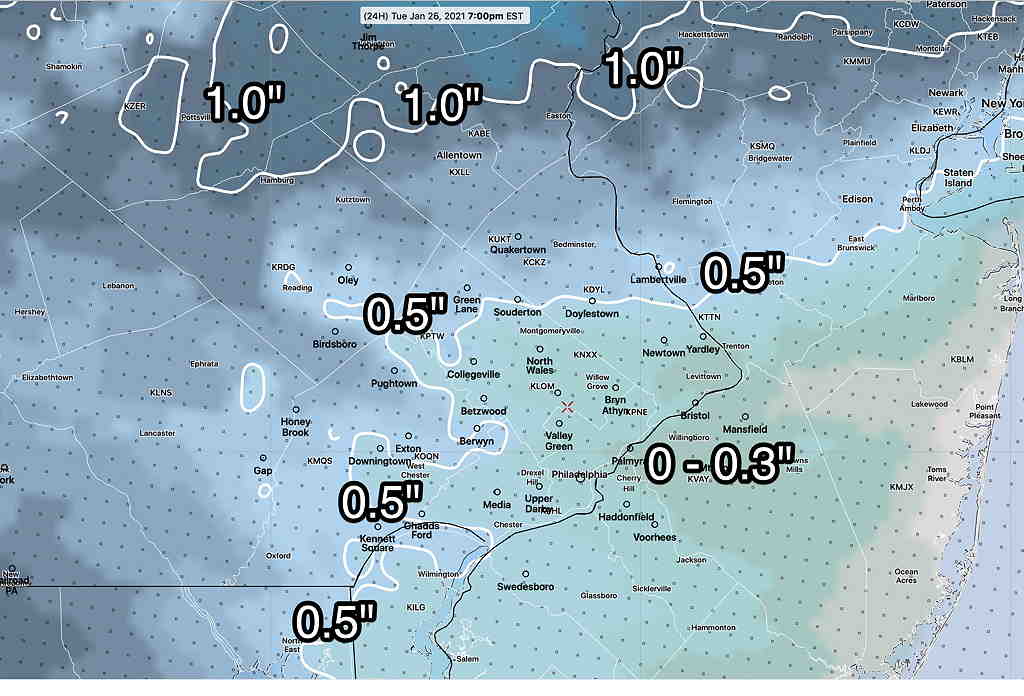
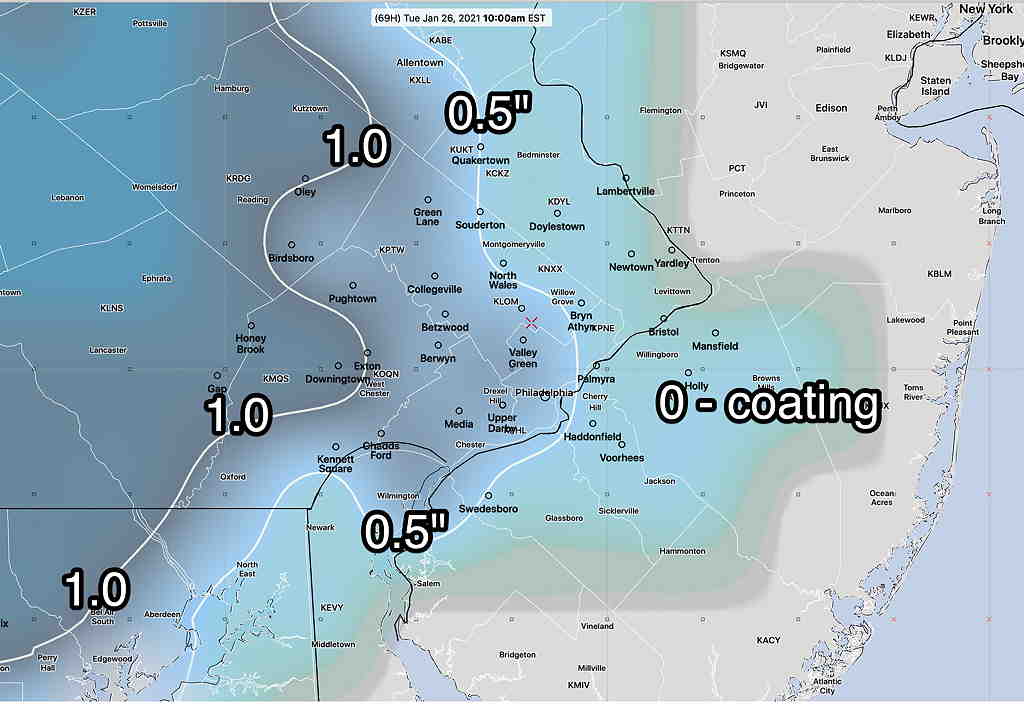
Using some new software, here’s the GFS projected snow totals for this potential storm—
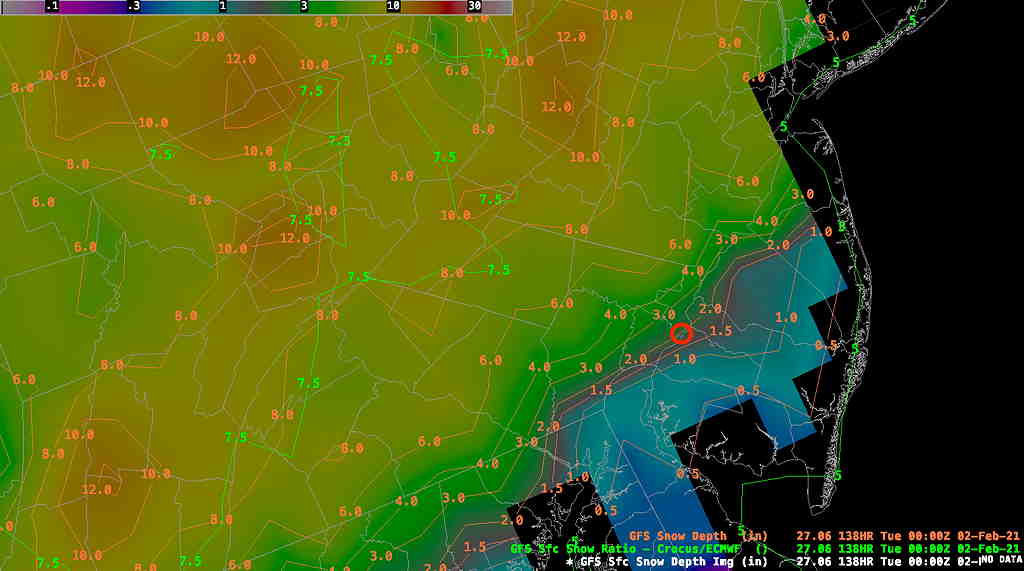
Stay tuned.