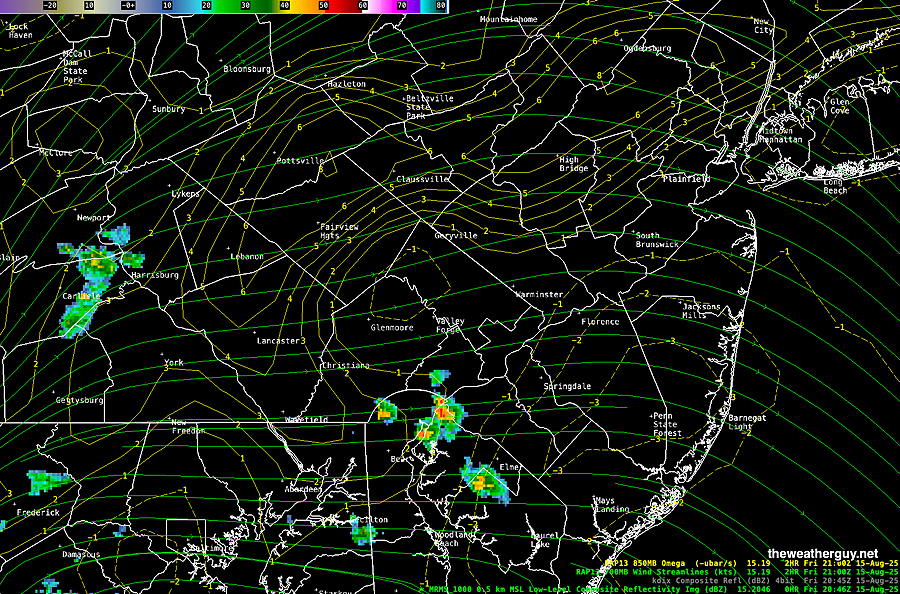
Some storms have fired up to our south and west Friday afternoon—
Radar Fri 4:30 PM with superimposed RAP model omega and 700 mb windstreams (10,000 feet) (Click on image for a larger view.)
A weak, slowly approaching cold front will bring the chance of widely scattered thundershowers Saturday and Sunday afternoons. Exact placement and timing still to be determined but mostly far west and north of the city.
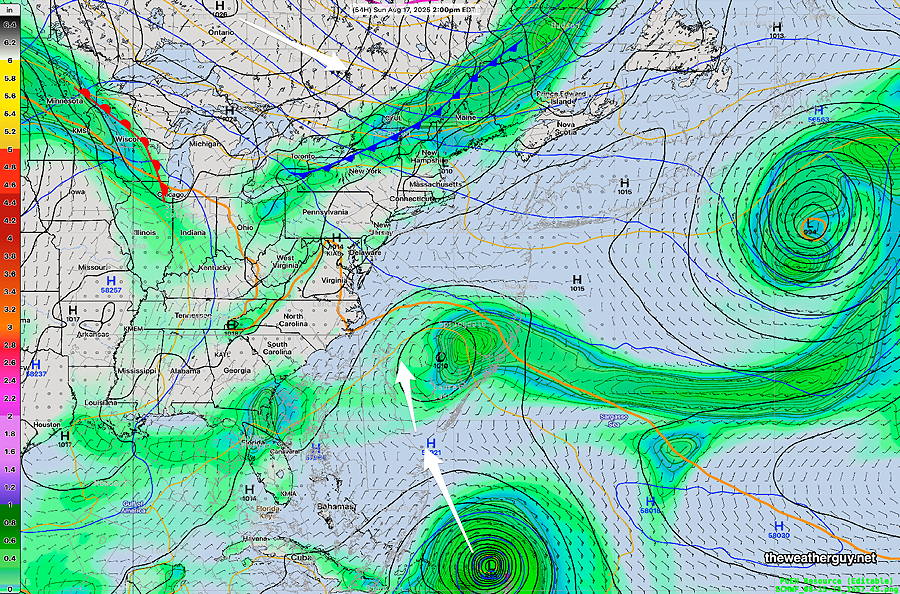
12zECMWF-AI model forecast for 2 PM Sunday. Cold front to our northwest. Tropical disturbance (Hurricane Erin) to slowly move northwestward. (Click on image for a larger view.)
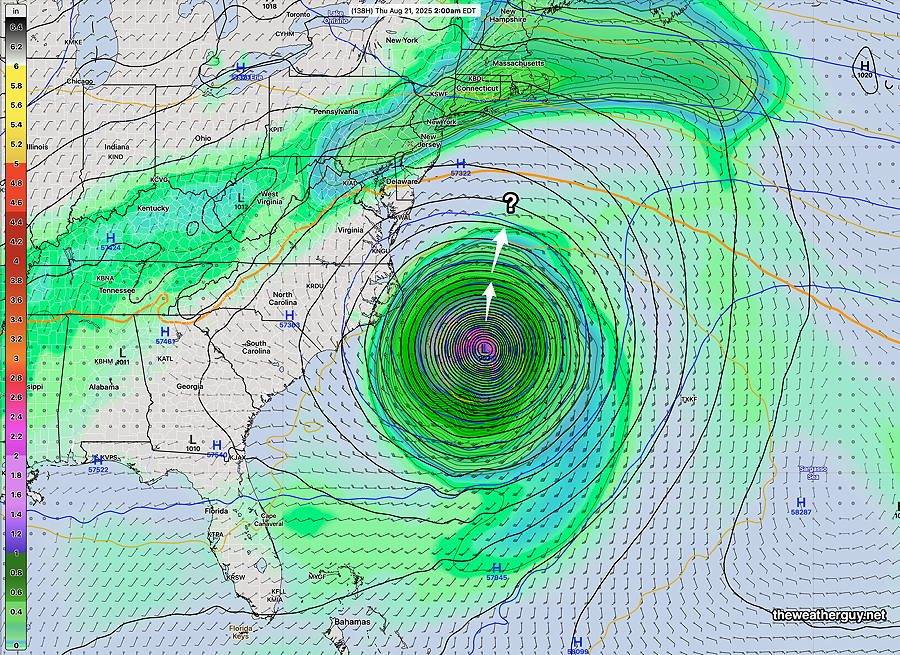
The latest ECMWF-AI model forecast for Hurricane Erin takes it still closer to the coastline of NC lateWednesday. This AI model did very well with last year’s hurricane predictions. It’s been back and forth regarding the track of Erin. Here’s the latest—
12z ECMWF-AI model forecast for late Wednesday night. Closest forecast track so far. (Click on image for a larger view.)
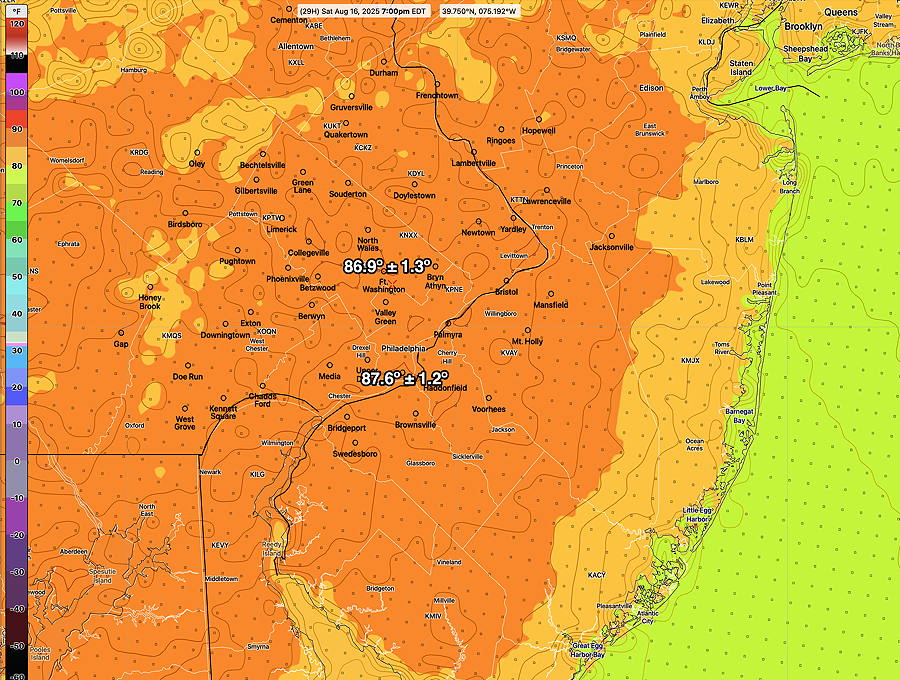
Typical August temperatures and humidity for this weekend.m Afternoon scattered to isolated storms mostly north and west of the immediate PHL area.
Saturday
Partly to mostly sunny. Chance of a widely scattered thunderstorm mainly west of our area. Heat index 91 for PHL
18z Model Blend (NBM) high temp Saturday low uncertainty Contours are 1º increments (Click on image for a larger view.)
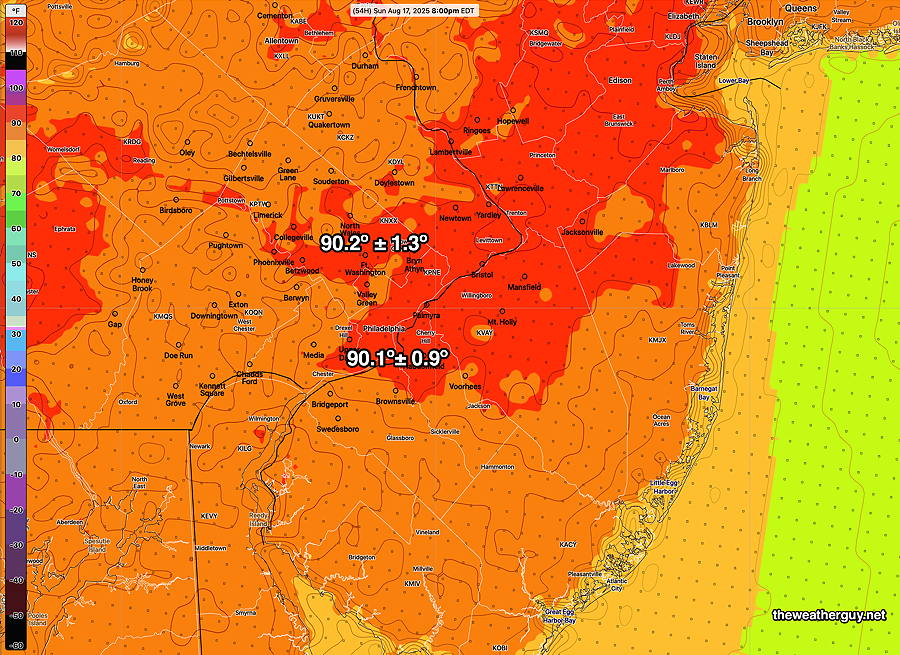
Sunday
Partly sunny. Chance of a widely scattered thunderstorm mainly west of our area late afternoon. Heat Index 96º Philadelphia.
18z NBM high temp Sunday. Low uncertainty. Contours are 1º increments (Click on image for a larger view.)
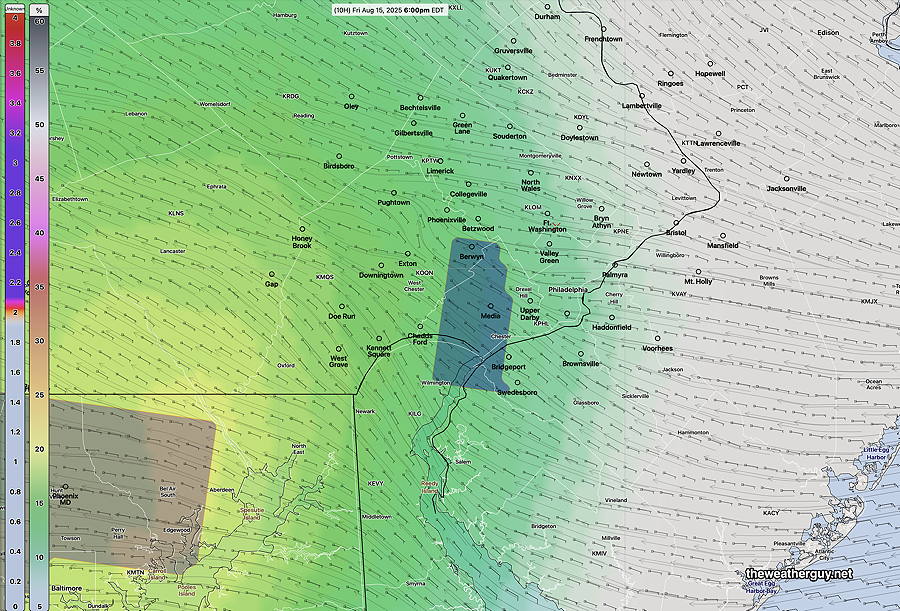
Posted Friday 08/15/25 @ 10:26 AM — A quick update. Today’s storms will be south of the city and west. Here’s a combined thunderstorm probability and thunderstorm coverage density map—
12z NBM thunderstorm probability (green yellow) and boxes (high density likelihood) at 6 PM (Click on image for a larger view.)
Thursday Thunderstorms
Thu 6:06 PM —Forecast Review — Today’s thunderstorms occurred mostly south and east of Philadelphia, generally in the range of the NBM forecast posted earlier today.
Radar at 4 PM Thursday. (Click on image for a larger view.)
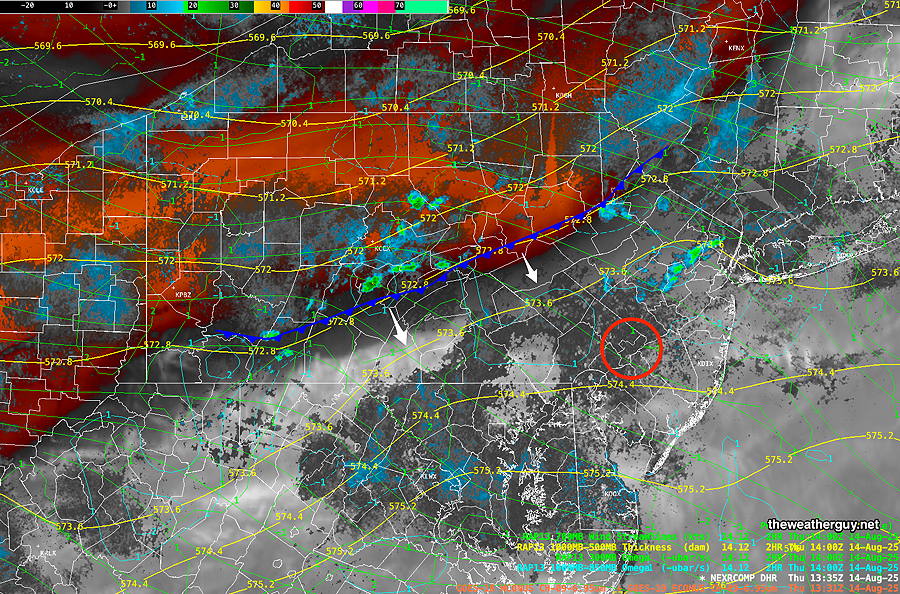
Posted Thursday 08/14/25 @ 9:36 AM — An upper short wave/trough caused yesterday’s storms. A weak ‘cold’ front moves through later this afternoon. The front really represents only a boundary for a slight drop in dew points pushed in from the north—
Current satellite water vapor image with superimposed RAP model 500-1000 mb thickness lines (yellow), 700 mb wind streamlines and superimposed MRMS radar. (Click on image for a larger view.)
Low level winds causing low level moisture convergence will result in thunderstorm formation today, likely not as widespread coverage as yesterday.
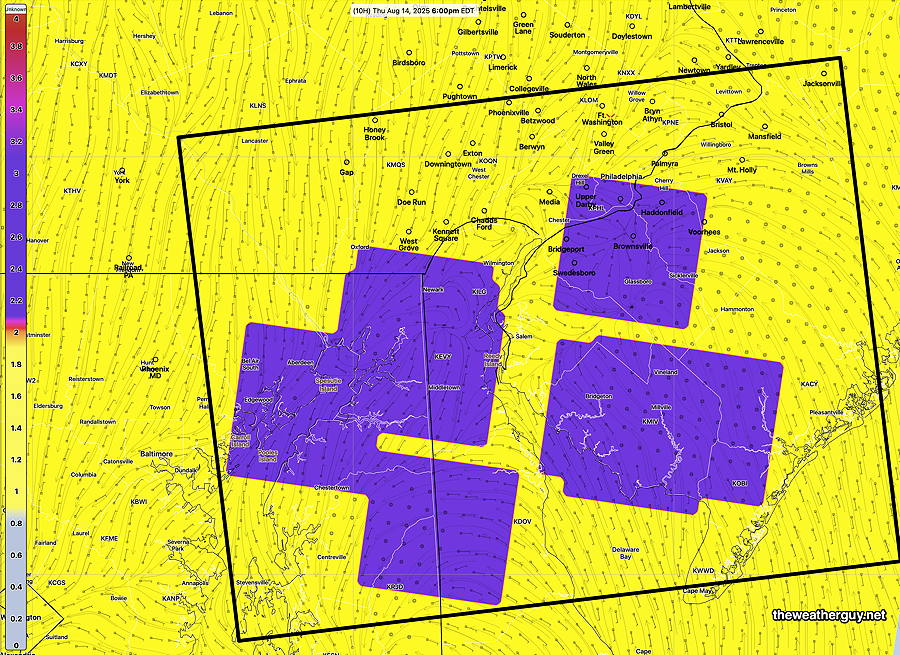
12z NBM Thunderstorm Coverage. Black box outlines most likely area for thunderstorms (Click on image for a larger view.)
Storm Timing: early afternoon for coastal NJ, especially Atlantic and Cape May counties. 4-8 PM for the boxed area above.
Hurricane Erin Update: Thursday’s ECMWF-AI has the storm again curving further away from the US coast.
Hurricane Erin
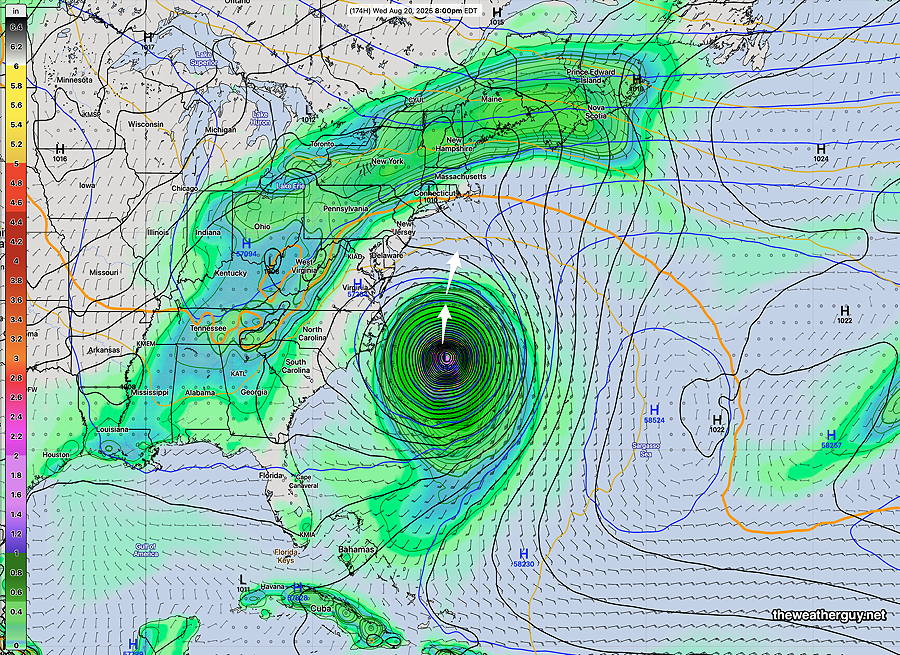
Posted Wednesday 08/13/25 @ 8:36 PM — A quick note about Hurricane Erin. The latest ECMWF-AI model just became available and it takes Erin the closest to the coast of North Carolina than any previous model run. Something to keep an eye on.
18z ECMWF-AI model shows hurricane Erin 250 miles off the coast of NC at 8 PM Wednesday. Something to watch. (Click on image for a larger view.)
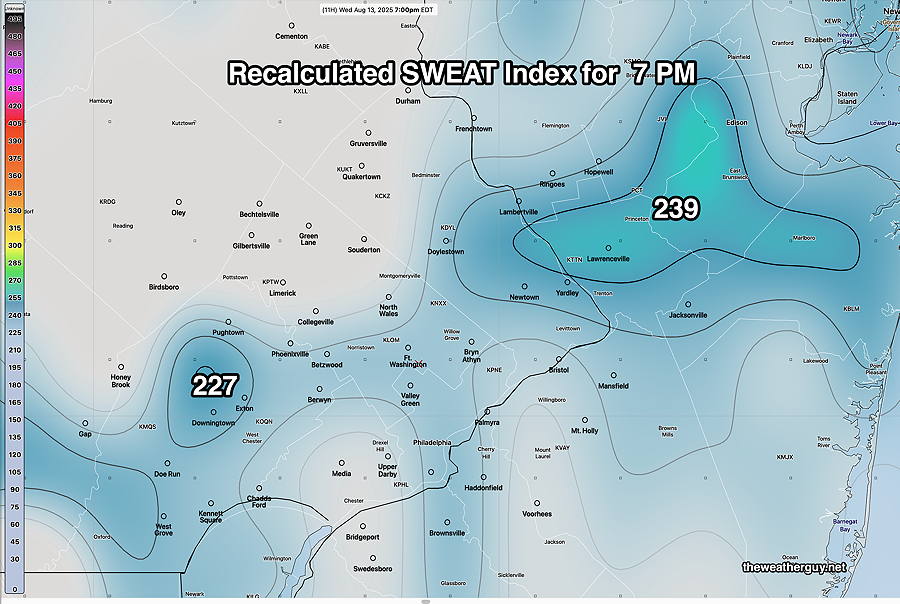
Wed 8:05 PM —Forecast Review — We had the heavy rain and but I wouldn’t characterize the overall storms this evening as severe. Just strong. The high numbered SWEAT Index graphic I posted earlier today from an official weather data server doesn’t seem to jive with the actual weather observed.
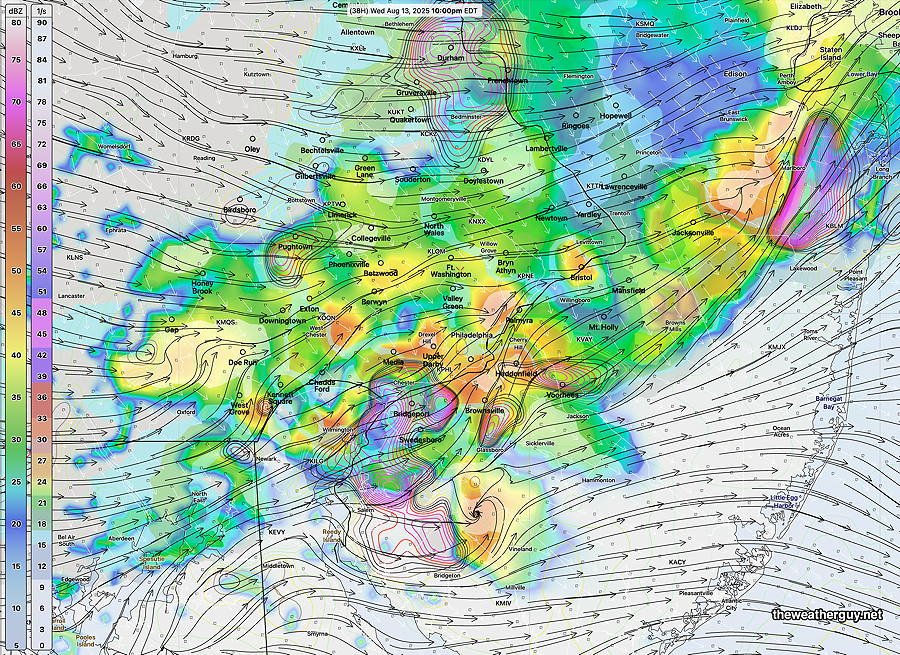
I spent several hours today with ChatGPT with the goal of calculating my own SWEAT index graphics from HRRR data. I used a formula posted on the College of DuPage Meteorology which gates the calculation for low vertical shear days (like today.) The result I have has values under 250, quite different from the very high 380 values from this morning’s graphic. This calculation feels more inline with the severity of the actual storms that passed through early this evening—
Same 12z HRRR model run with recalculated SWEAT index forecast at 7 PM. These values are more in line with the severity of the storms that passed through. (Click on image for a larger view.)
We’ll need a few more thunderstorm days to see if the SWEAT Index has any added value, or if it’s use is just due to its nifty acronym.
Severe Weather Threat Index (“SWEAT” INDEX)
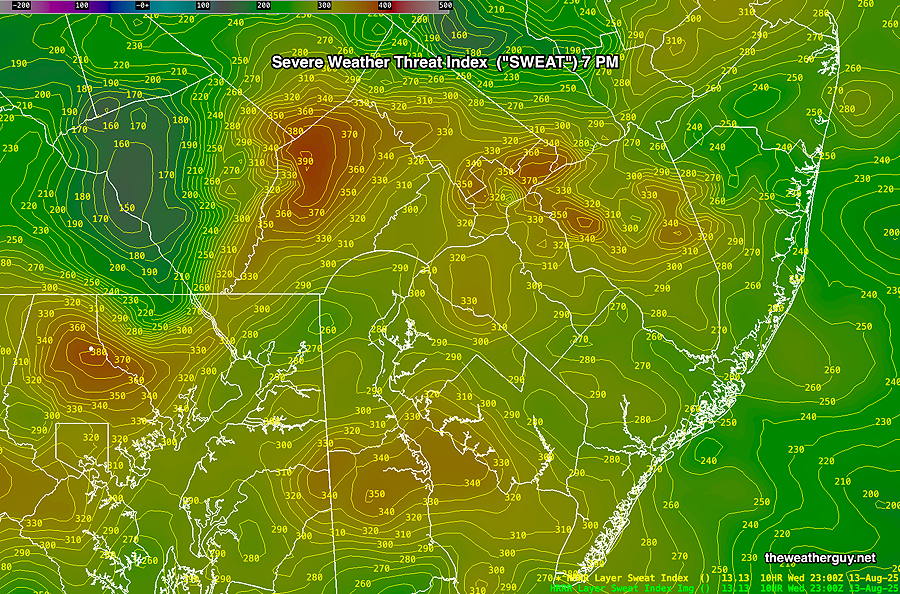
Posted Wednesday 08/13/25 @ 10:37 AM — I’m going to try something new today— The SWEAT INDEX, a calculated empirical predictor of severe weather storms. While my usual reliance of vertical shear, helicity, CAPE and ‘lifted index” works pretty well, those parameters are suggesting little in the way of widespread severe weather later today.
The SWEAT index combines some of these parameters into a composite score and includes wind speeds (kinematic parameters). > 300 Severe Thunderstorms likely > 400 Tornadoes likely
According to this morning’s HRRR (13z), the SWEAT Index is in the high 300s, especially near the city—
13z HRRR based SWEAT Index at 7 PM Several areas of high 300s suggests more widespread severe weather than I previously indicated. (Click on image for a larger view.)
So, we’ll see if this index is useful today.
Wednesday – Thunderstorms
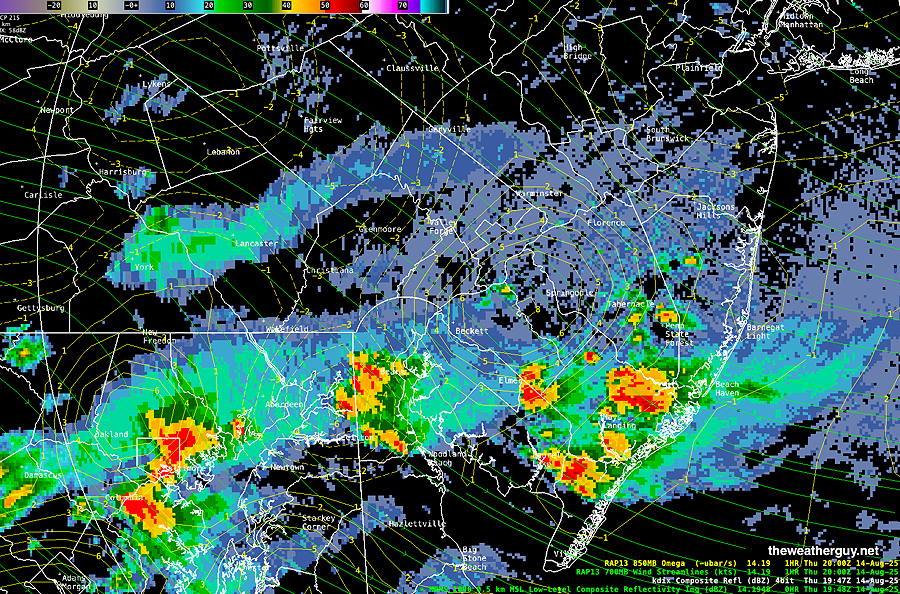
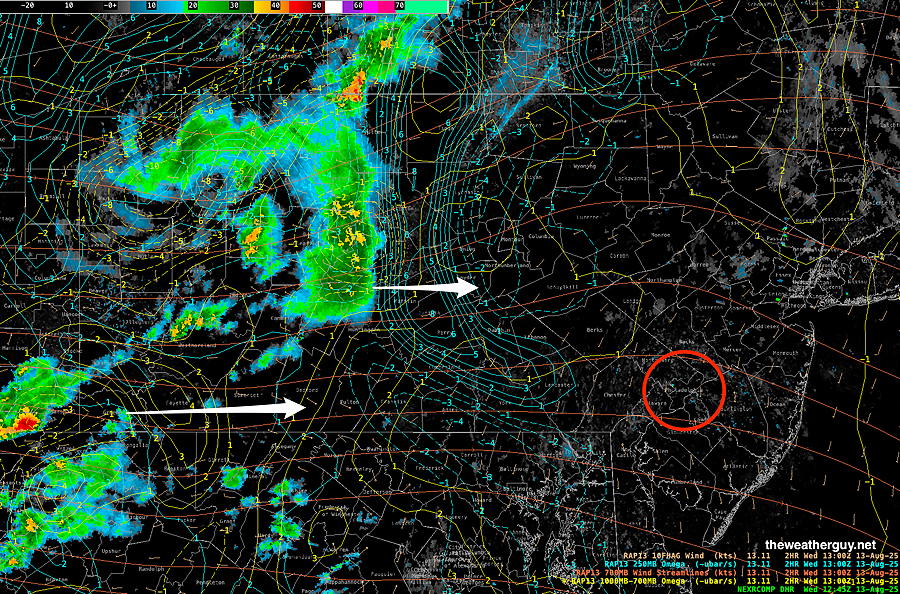
Posted Wednesday 08/13/25 @ 9:26 AM — As described in my previous post, thunderstorms are expected to break out late Wednesday afternoon and evening. The latest models show storms to be more widespread than previously forecast, although the widespread severity threat is expected to be relatively low. Current radar shows the activity in western PA—
Radar ~8:30 AM with superimposed RAP model omega and 700 mb wind streams. (Click on image for a larger view.)
Timing: While a few isolated storms are possible western sections, most of our area won’t see any activity until after 4 PM, moving from west to east. Peak activity in our area will be 6-9 PM, especially 7 PM. Localized heavy rain is possible along with some strong wind gusts. (As the NWS always says, there’s the risk of “dangerous lightning”, I guess that’s in contrast to some lightning variety that isn’t dangerous.)
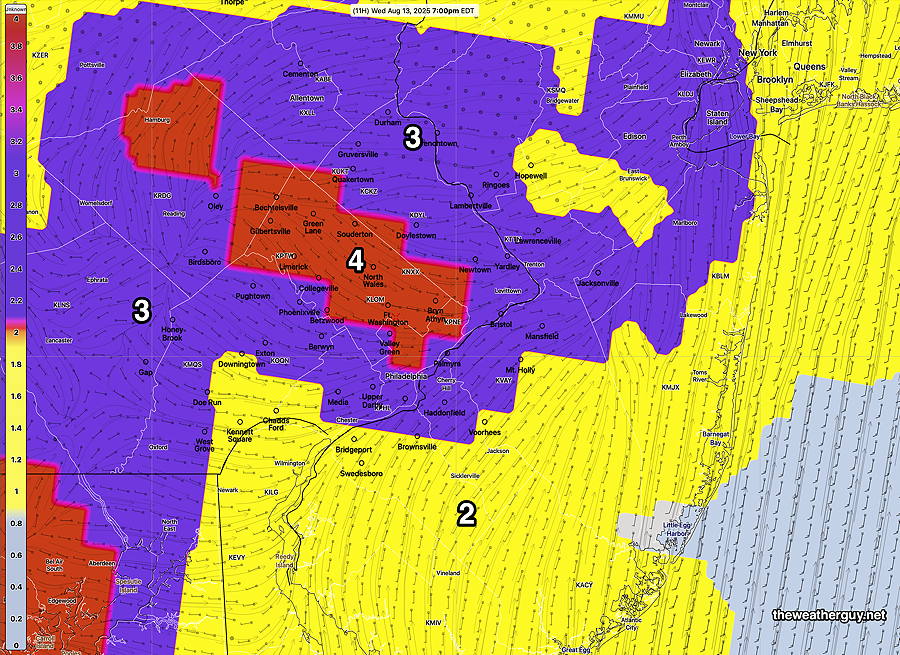
The model blend (NBM) creates a thunderstorm coverage parameter (1-4) with 4 being the highest. The NBM shows very dense thunderstorm coverage at 7 PM in these areas—
Today’s 12z NBM thunderstorm coverage at 7 PM. Numerous storms (4) expected at 7 PM in red areas. (Click on image for a larger view.)
This weather event doesn’t merit a ‘severity table’. The latest HRRR shows low shear and helicity. However, there’s always the possibility of a surprise severe storm.
Models guiding this forecast: HRRR, REFS, NBM, RAP
Active Weather Wednesday
Posted Tuesday 08/12/25 @ 8:02 PM — An upper level short wave will move through during the afternoon and evening hours on Wednesday.
An increase in humidity Tuesday night will result in fog Wednesday morning. There may even be some light patchy drizzle in some areas around daybreak.
Clouds should break late morning for hazy sunshine through a layer of high cirrus clouds. With daytime heating and the moisture in place, the approaching shortwave will result in showers and thunderstorms as early as 2-4 PM. These will be scattered and it won’t be possible to pinpoint the exact locations in advance. Showers and storms will become more numerous by early evening. Some of these storms will likely result in pockets of heavy rain.
The Canadian RGEM and the RRFS along with the HRRR are forecasting areas of unusually heavy rainfall ( 3.7″) with storms right around the immediate Philadelphia area through much of the evening. Some strong dynamics move through about 9 -10 PM with possible severe weather.
We’ll have a better handle on severity aspects Wednesday morning. I’ll update after 8:45AM with the new data.
Monday Update
Mon 8:37 PM —Forecast Review — Today’s high temp at the airport was 88º.
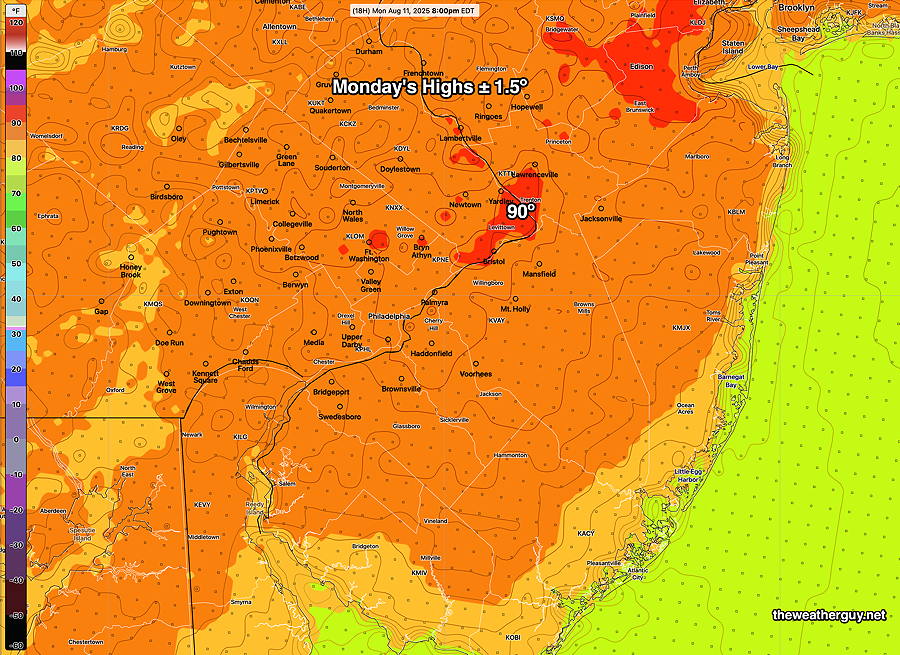
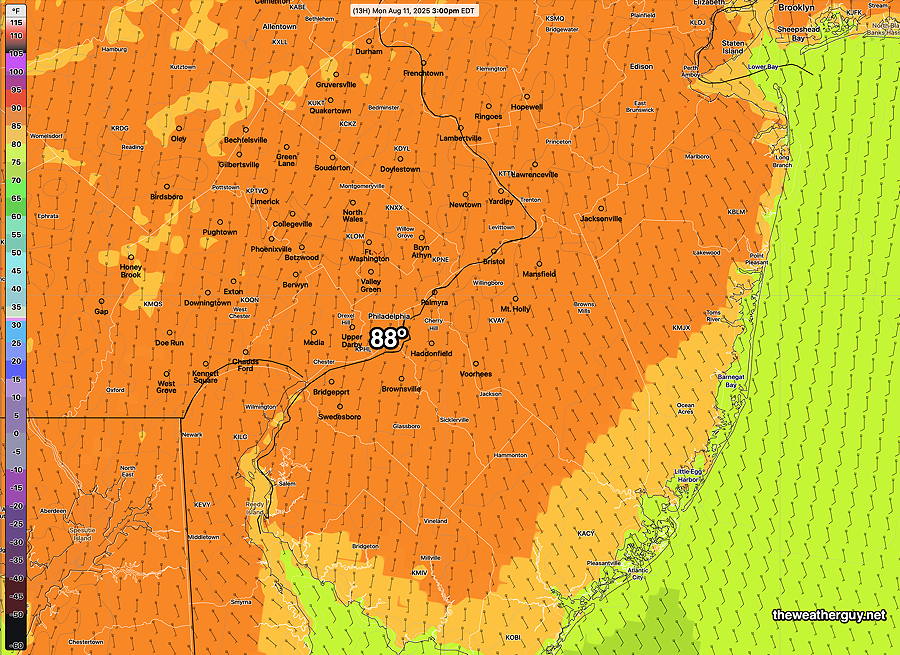
Posted Monday 08/11/25 @ 9:20 AM — I’ve been hearing much about temperatures reaching 90º here today. That certainly may happen, but most models have us in the upper 80s, with only a small area reaching 90º. Add the low humidity and the apparent temperature (heat index) will be in the upper 80s just about everywhere.
06z NBM forecast 12 hour high temperatures for Monday. Very small area reaches that temp. (Click on image for a larger view.)
Factor in the low humidity, and the apparent temperature is only in the upper 80s—
06z NBM Apparent Temperature (heat index) for Monday.
Tuesday will likely reach 90º in more areas. Wednesday‘s high temps may be damped down to the low 90s due to cloud cover, but Wednesday’s humidity will be noticeable with the heat index in the mid 90s.
Regarding the likely western Atlantic hurricane next week, it appears it will be blocked from moving westward. Current AI model tracks suggest a movement to the north, then northeast away from the coast.
Originally Posted Sun 9:52 PM —An increase in heat and humidity will be in store for the Philadelphia area this coming week, especially noticeable Tuesday and Wednesday. An approaching cold front will bring some showers and storms sometime late Wednesday afternoon or evening. Temperatures in the 90s will be widespread by Tuesday and Wednesday, with heat indices significantly higher.
The new dry period we’ve recently entered may not be broken by the showers late Wednesday, as most of the shower/storms are currently forecast to stay to our north and west. That may change, especially since the front may linger nearby on Thursday.
Long time followers of this blog know that I’ve seen a relationship between hurricane development near the continental US and model forecast accuracy of seemingly unrelated weather far from the storm.
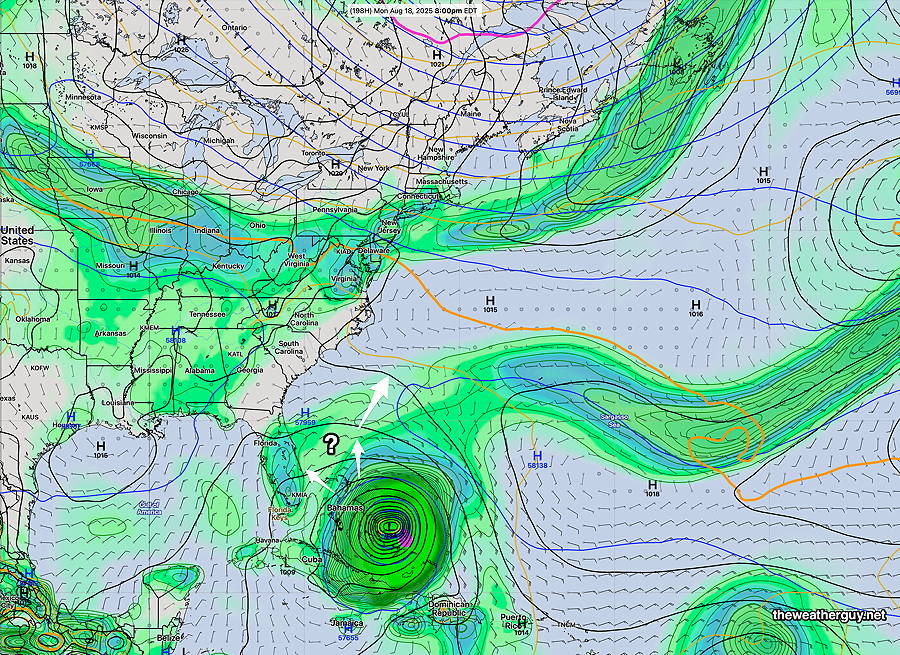
This may become a factor as we approach the weekend and beyond. A tropical system, likely a hurricane will approach the southeastern US. Track of the storm is uncertain, but the European AI model was outstanding last year. It currently is forecasting a hurricane (AL97) approaching Florida or South Carolina by next Monday evening or Tuesday.
Many models are forecasting this storm’s formation and there’s disagreement in the eventual track, even between the current GFS-AI and ECMWF-AI models. Here’s the ECMWF-AI—
Today’s 18z ECMWF-AI Single forecast for NEXT MONDAY at 8 PM (Click on image for a larger view.)
When we have such beautiful weather in August, there’s not much to write about. Sun, minimal clouds, light winds, smooth sailing.
High pressure will block the very hot weather to our west through early Monday.
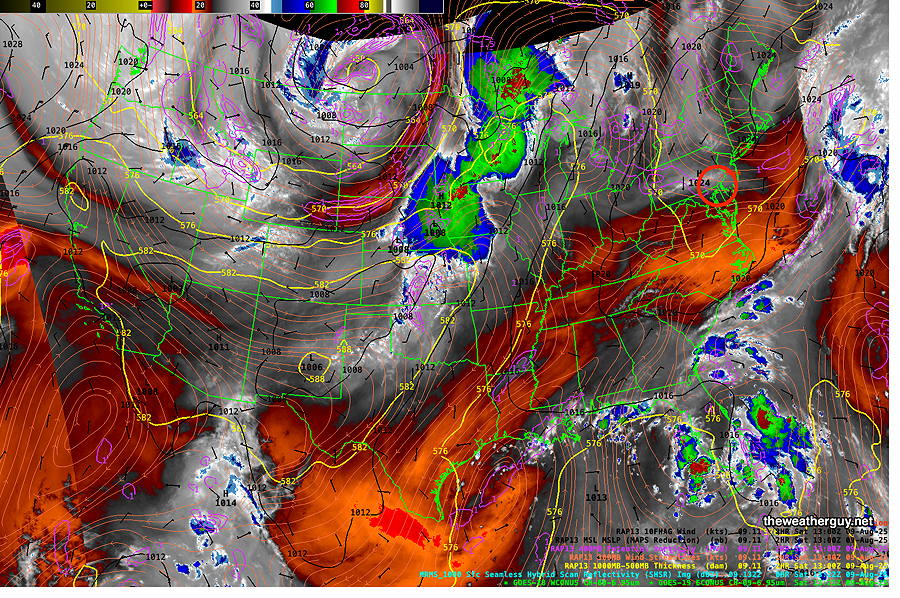
Current satellite water vapor image with superimposed RAP model 500-1000 mb thickness lines (yellow), Mean Sea Level Pressure isobars (black contours) potential vorticity (fine violet contours) with superimposed MRMS RADAR. Water Vapor Imagery reveals emitted water vapor infrared TEMPERATURE, NOT REFLECTED LIGHT from CLOUDS. Water Vapor Temperatures indirectly reveal height, called the “effective layer”, of the water vapor in a region, therefore revealing the mid and upper level 3D contours of systems. Colder temperatures (blue- grey – white) indicate higher altitude, often revealing upward motion. Red- Orange indicates warmer temperatures and a lower height for this layer. (Click on image for a larger view.)
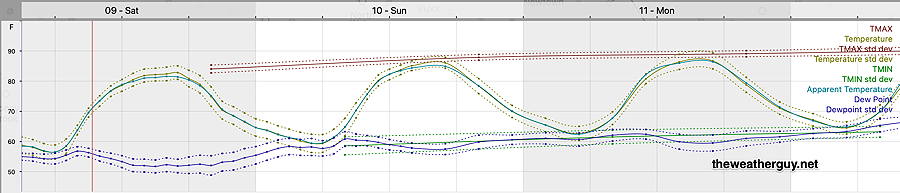
Here’s the updated model blend (NBM) forecast temperatures and humidity meteogram for Blue Bell, PA through Monday—
06z NBM forecast temperatures, dew points and apparent temperatures (heat index) for Blue Bell. Philadelphia temps run about 1.5-2º higher. (Click on image for a larger view.)