
#Philadelphia #weather #PAwx #PhillyWx
I was out on a hike this morning and looked at the darkening skies to our north. I downloaded new data to my iPhone remotely and and saw the radar in no way matched the model forecasts from even two hours earlier. I remotely uploaded the “Update” below at 10:43 AM.
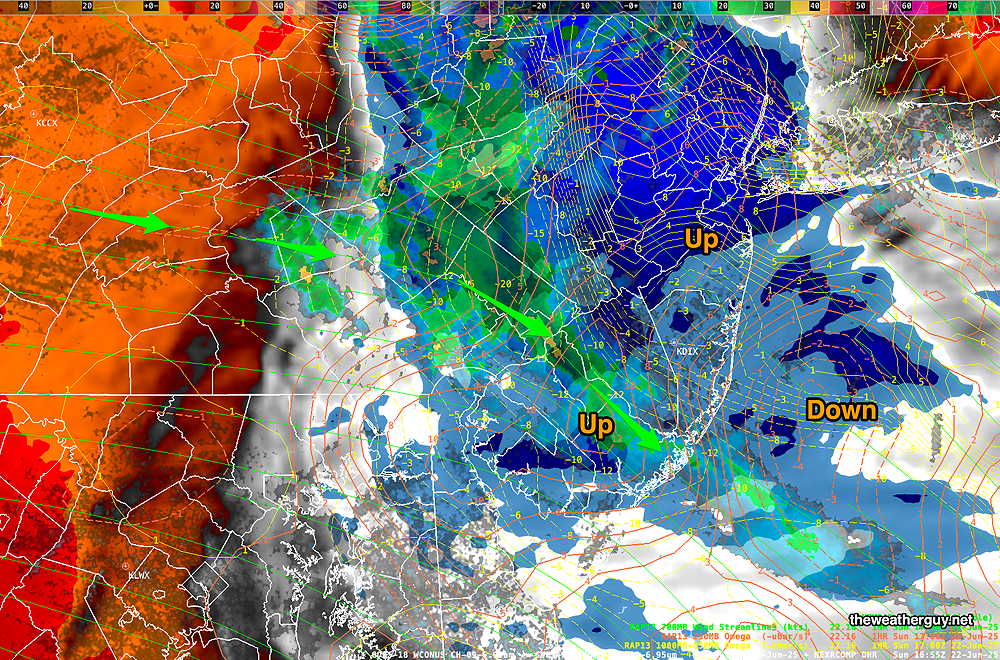
Here’s the current radar with the hourly RAP model superimposed—
(Click on image for a larger view.)
This morning’s HRRR (12z -8AM EDT) shows the a diminished mesoscale complex moving far north of us at 1 PM—
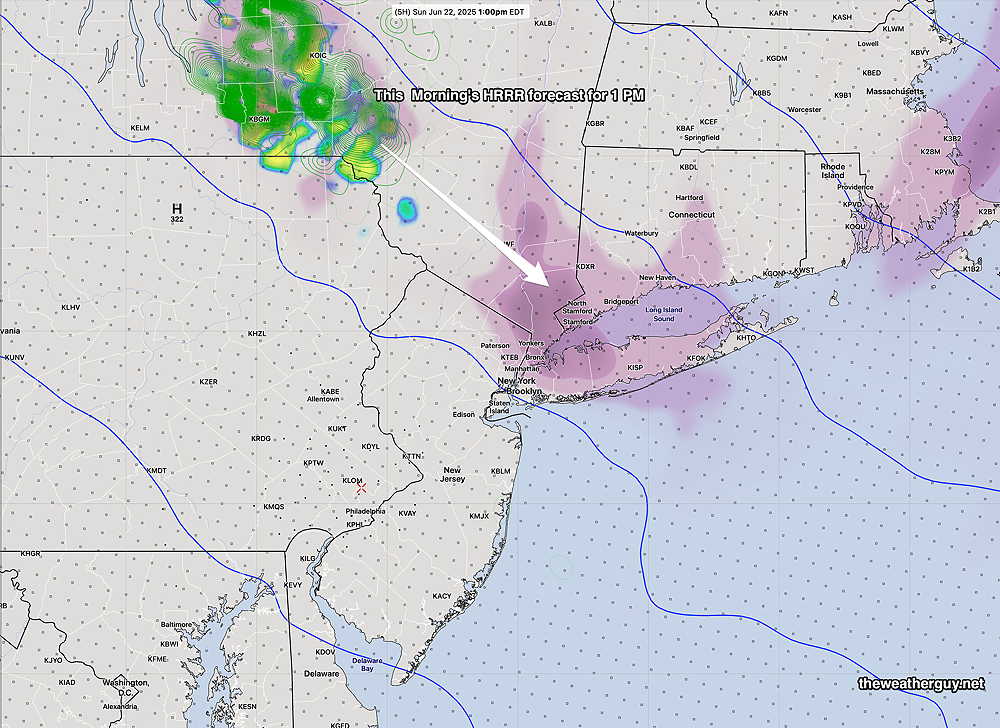
The HRRR is one of our best “CAM” models. (CAM = “Convective Allowing Model”, the sort of process occurring that this model is designed to capture. ) Clearly, there was some input upper air data problem at the very least.
Our newest CAM model, the experimental RRFS showed a bit of activity with a 14z (10 AM) model run. Still quite disappointing.
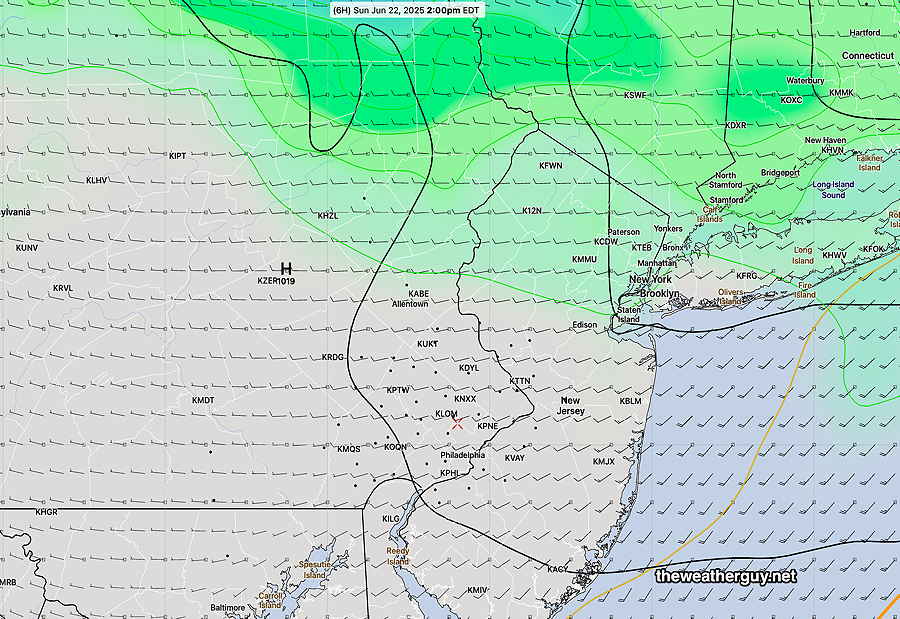
Even this morning’s ECMW-AI model, just available, didn’t get this right—
As I’ve said as recently as last week, these modeling errors and forecast ‘surprises’ is one of the things that I find fascinating about meteorology.
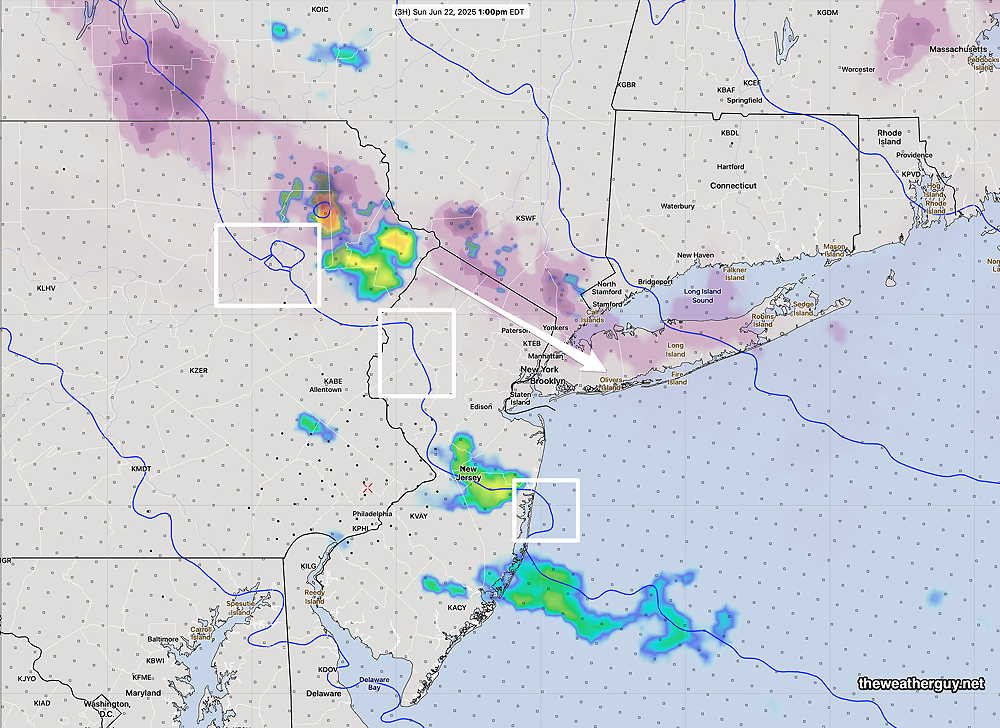
Update Sun 6/22 10:43 AM — The large area of rain to our far north was forecast by the models to be further north than currently on radar. They were also forecast to dissipate. They are the result of hot humid air pushing northward in the mid levels of the atmosphere.
The latest HRRR still shows it dissipating as it approaches.
Posted Sunday 06/22/25 @ 9:14 AM — The Canadian Meteorological Center (CMC) announced their release this week of their advance into AI weather models with the release of an experimental global model based on the GDPS. (GDPS-AI) . The CMC describes this new model as “spectrally nudged” towards an AI model. (Weather models use wave-form physics (spectral methods) to recreate the atmosphere structure and dynamics.)
The GDPS-AI is run twice daily, 00z and 12z and becomes available four hours and 45 minutes after it is run. It forecasts out 240 hours. The nice thing about this AI model: it has hourly forecasts through forecast hour 84, in contrast to the European and US AI models that forecast at 6 hour intervals.
My experience with the Canadian models has found their regular models tend to bias towards the high side of temperatures in this region during the summer months.
So let’s do an ‘experiment’. Let’s see if their AI version is forecasting temperatures that are too high today?
Here’s the latest NBM model, just available. Its highs are significantly less, but the temperatures have a wide uncertainty (standard deviation) of ± 2.2º (The NBM (“model blend”) is a weighted average of 30-40 models)
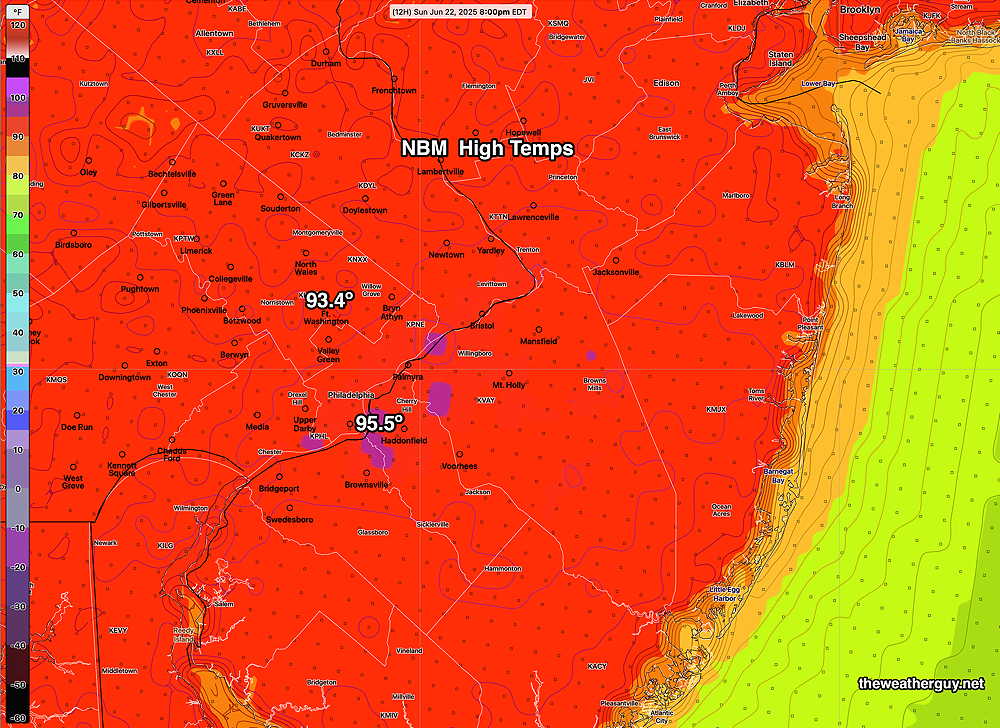
It wouldn’t surprise me if the NBM is more accurate today, assuming adding 1º-2º to to its forecast.
Originally Posted Sat 10:28 AM —The main weather feature of this weekend and much of next week will be a building upper level ridge, bringing very high temperatures and humidity to the Philadelphia region. The building ridge is visible on this morning’s water vapor image—
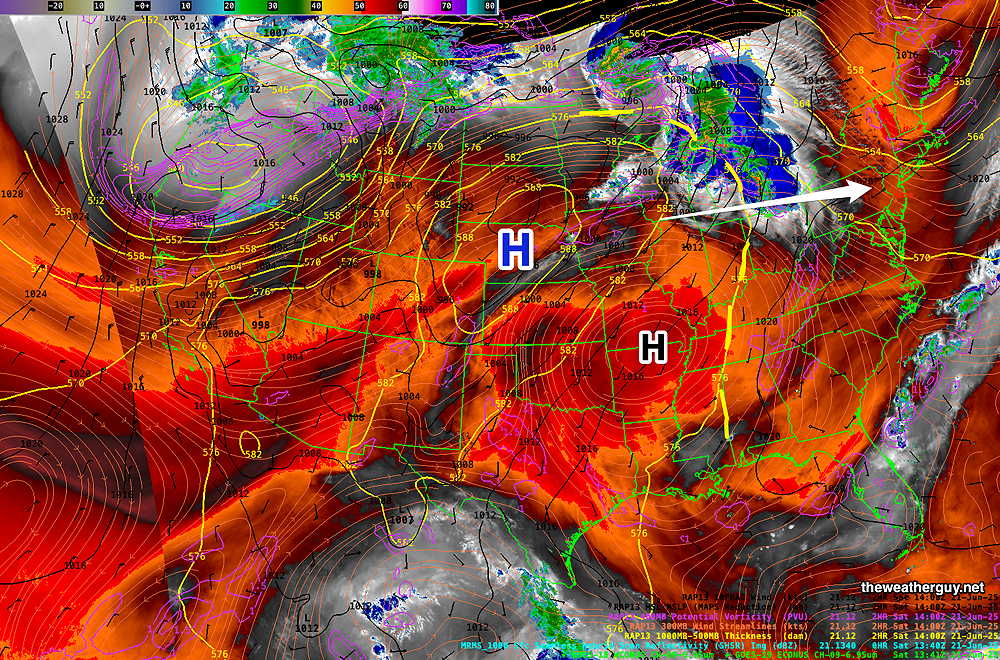
As a result, Water Vapor Temperatures indirectly reveal height, called the “effective layer” of the water vapor in a region, therefore revealing the mid and upper level 3D contours of systems.. Colder temperatures (blue- grey – white) indicate higher altitude, sometimes revealing upward motion. Red- orange indicates warmer temperatures and a lower height for this layer. There are several water vapor “channels”; the one I display here is called the mid level height channel. (Click on image for a larger view.)
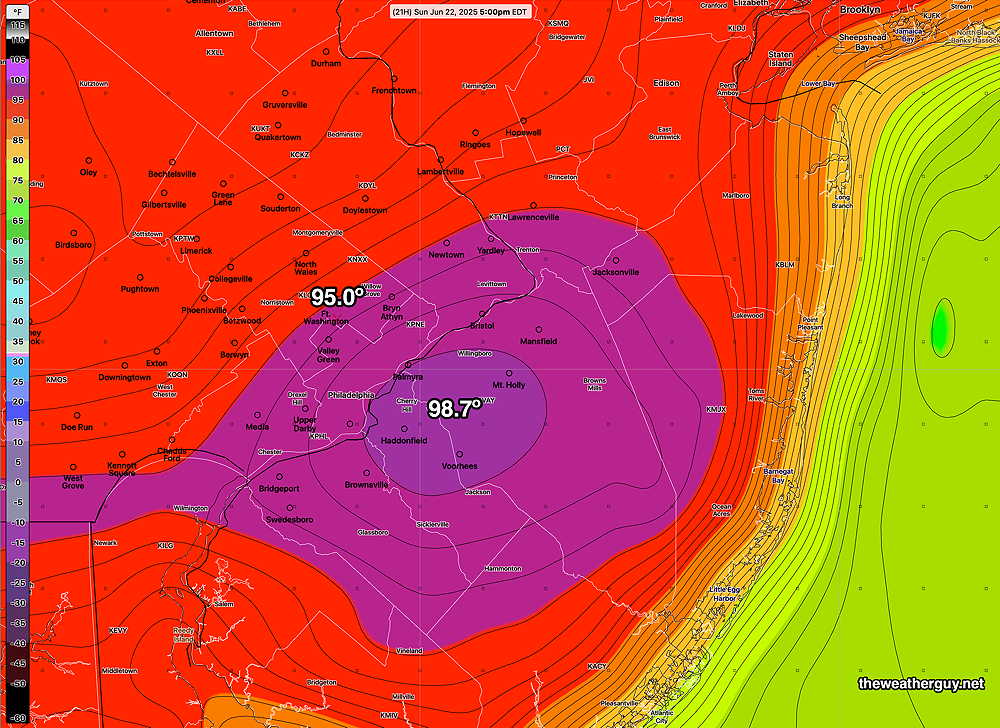
The expected temperatures based on the European AI model (the ECMWF-AI Single) were posted yesterday. When the temperatures here are hitting 100º, I don’t see that much value, (and only hype) in giving the heat indices.
According to the latest NBM, high temps will hit 90º today, Saturday near the city and 97º on Sunday.
When the temperatures get this hot, there’s always the possibility of an isolated thundershower popping up. A trigger is often needed for these to occur. The models show some storms in far northeastern PA later this afternoon.
Yet with the upper atmosphere being so hot, the upper level heat in many ways inhibits convective rainfall.