Sun 1:05 PM —Forecast Review — Not a forecast to be proud of— Both last night’s and even this morning’s models failed to forecast this “mesoscale complex” with strong upper air support dropping south along the edge of the mid level heat dome.
I was out on a hike this morning and looked at the darkening skies to our north. I downloaded new data to my iPhone remotely and and saw the radar in no way matched the model forecasts from even two hours earlier. I remotely uploaded the “Update” below at 10:43 AM.
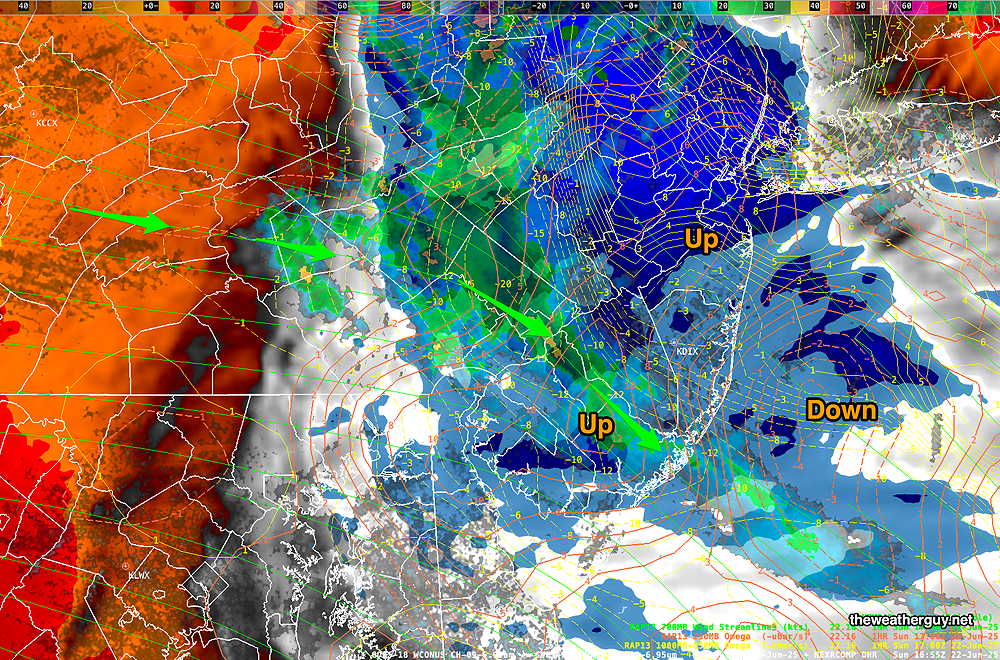
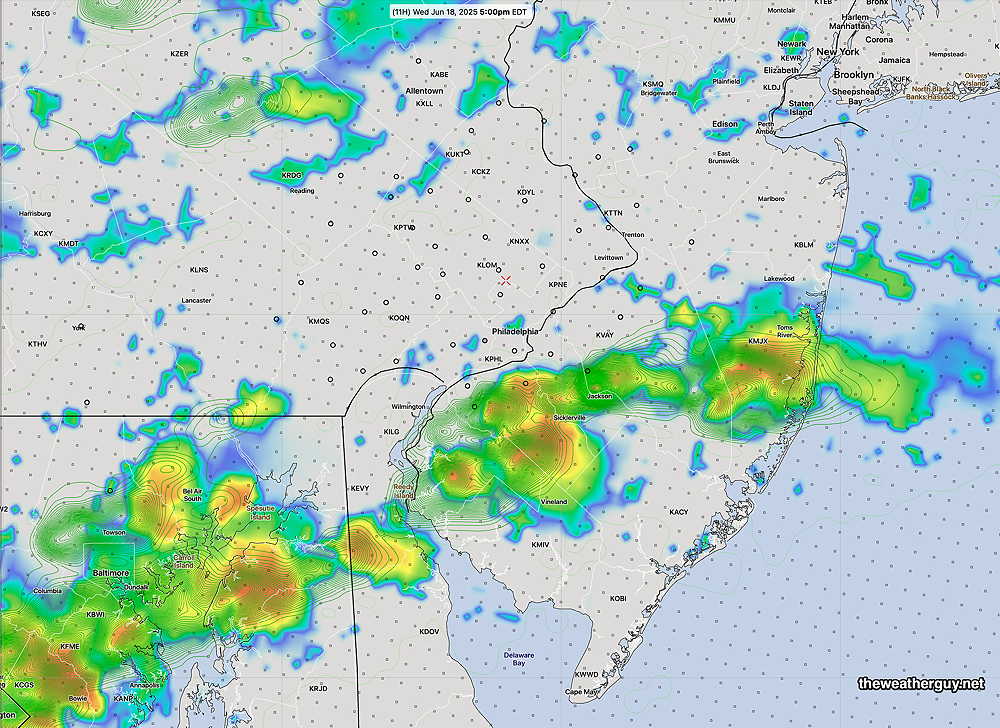
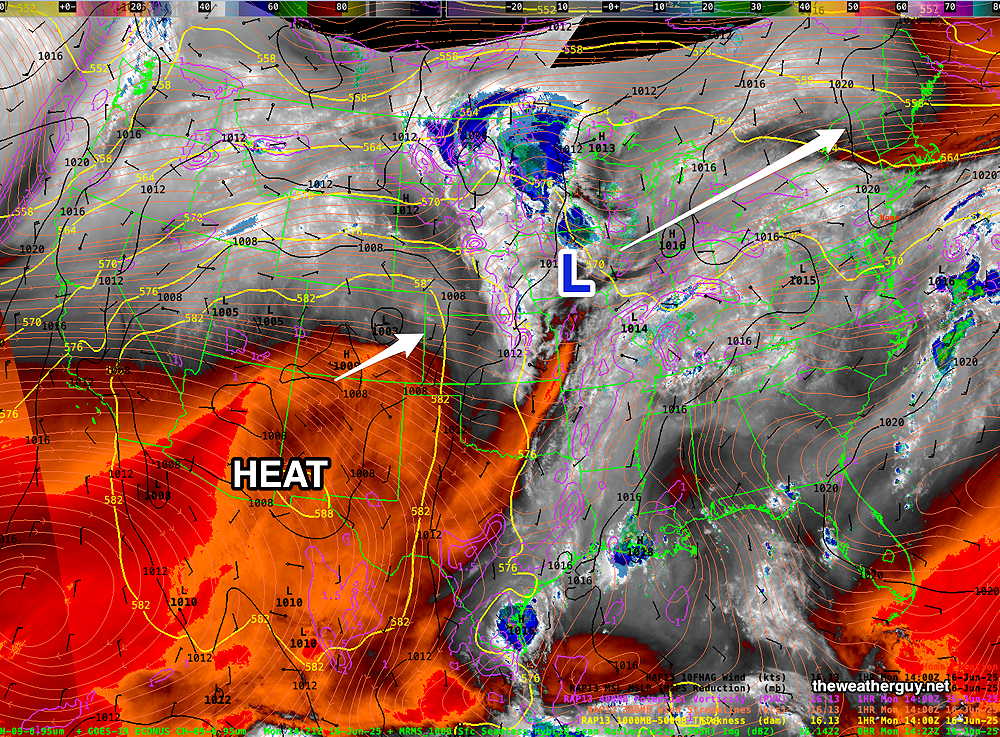
Here’s the current radar with the hourly RAP model superimposed—
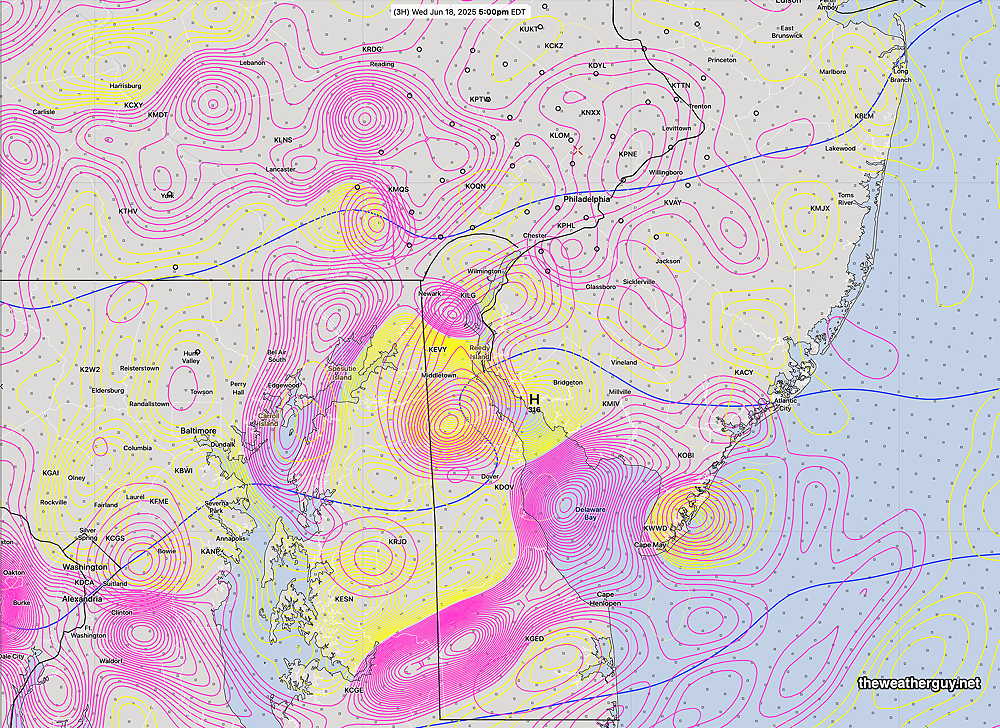
Current satellite water vapor image with superimposed RAP model 500-1000 mb thickness lines (yellow), Mean Sea Level Pressure isobars (black contours) potential vorticity (fine violet contours) with superimposed MRMS RADAR. Water Vapor Imagery reveals emitted water vapor infrared TEMPERATURE, NOT REFLECTED LIGHT from CLOUDS. Orange contours are jet stream level vertical motion. Strong UPward areas right over Philadelphia suburbs into NJ will enhance showers/storms. The blue shading is the strong upper air vertical motion of the Mesoscale Complex. (Click on image for a larger view.)
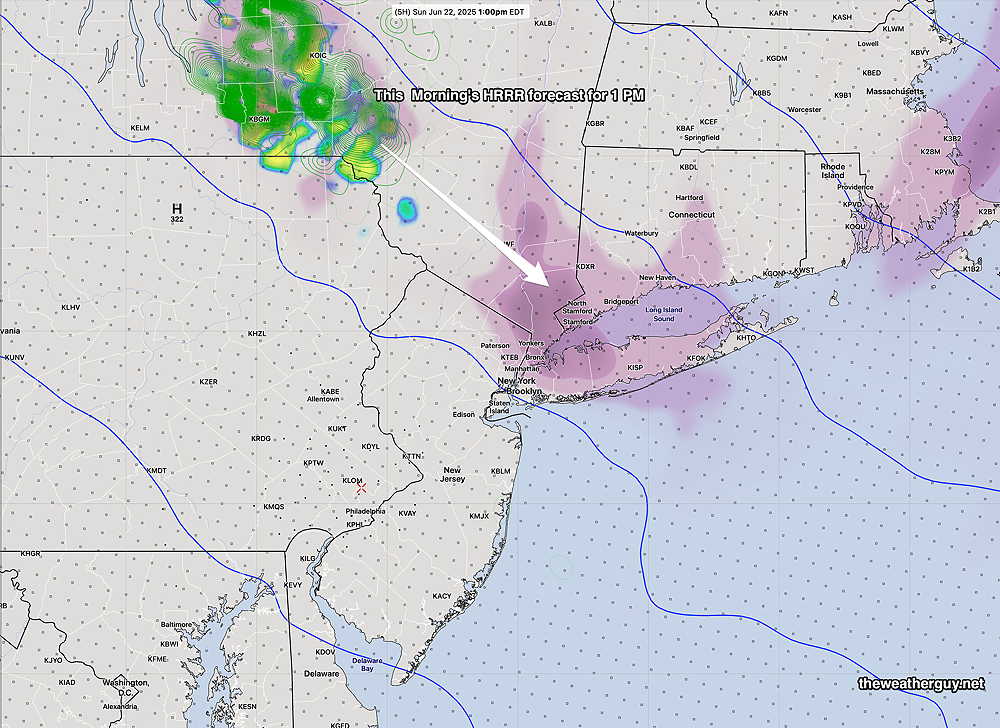
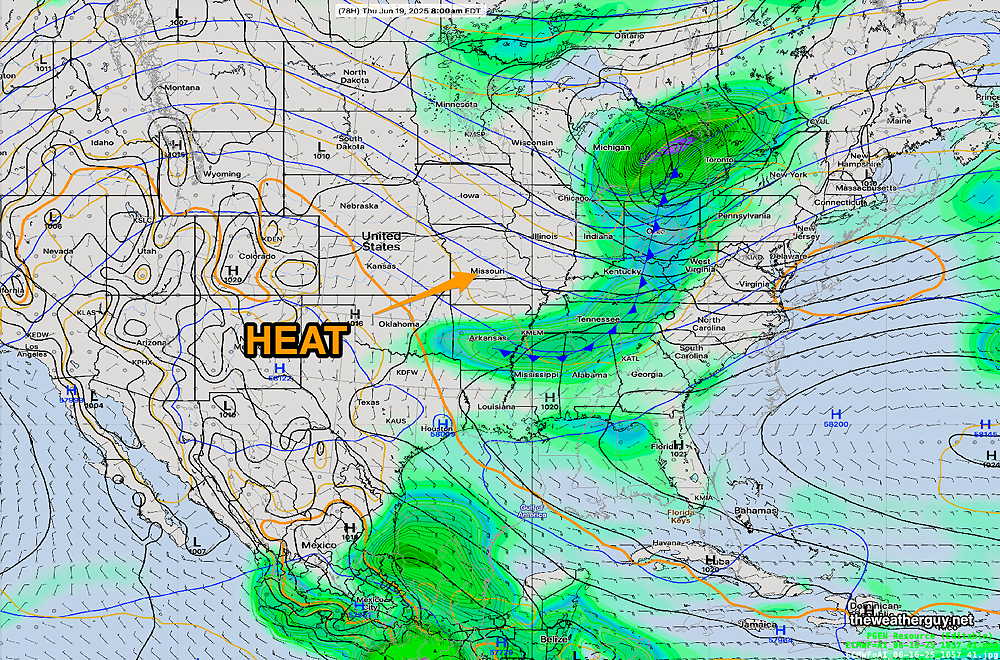
This morning’s HRRR (12z -8AM EDT) shows the a diminished mesoscale complex moving far north of us at 1 PM—
12z HRRR forecast for 1 PM Sunday. Rain stays well to our north. Completely under forecast the rain and position. (Click on image for a larger view.)
The HRRR is one of our best “CAM” models. (CAM = “Convective Allowing Model”, the sort of process occurring that this model is designed to capture. ) Clearly, there was some input upper air data problem at the very least.
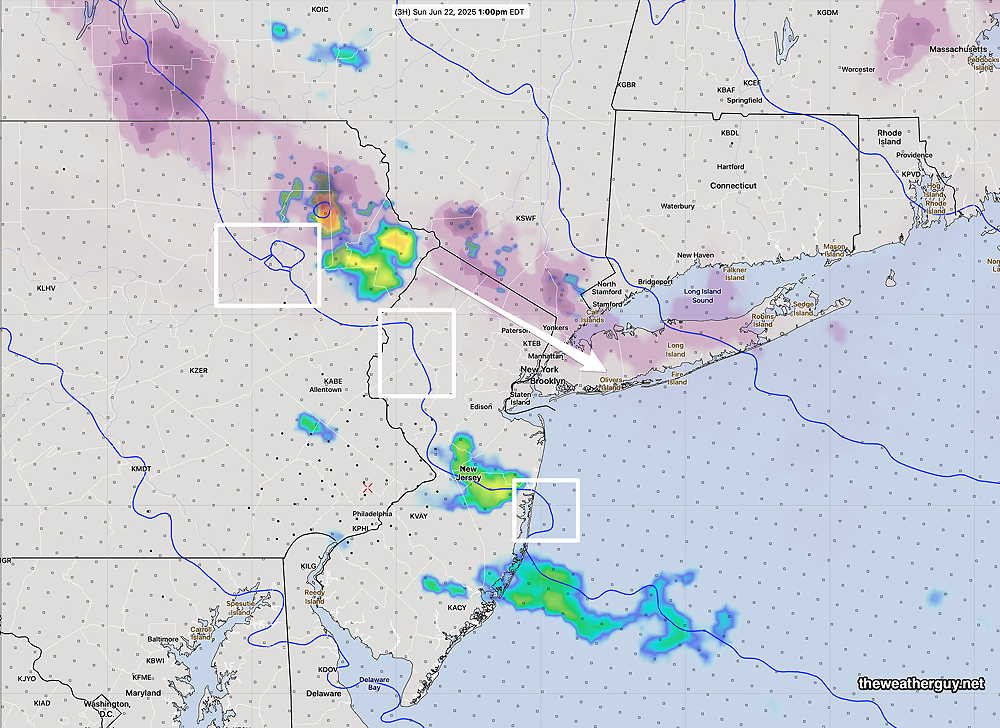
Our newest CAM model, the experimental RRFS showed a bit of activity with a 14z (10 AM) model run. Still quite disappointing.
14z (10 AM EDT) hourly RRFS (experimental) did somewhat better, but still not a good forecast. (Click on image for a larger view.)
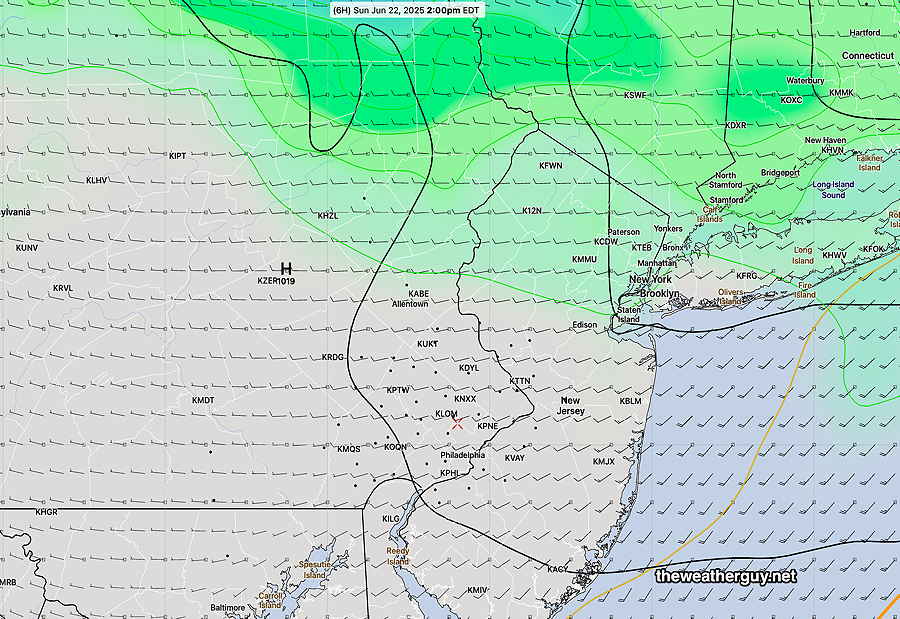
Even this morning’s ECMW-AI model, just available, didn’t get this right—
This morning’s 12z ECMWF-AI model kept the rain far north of our area. (Click on image for a larger view.)
As I’ve said as recently as last week, these modeling errors and forecast ‘surprises’ is one of the things that I find fascinating about meteorology.
Update Sun 6/22 10:43 AM — The large area of rain to our far north was forecast by the models to be further north than currently on radar. They were also forecast to dissipate. They are the result of hot humid air pushing northward in the mid levels of the atmosphere.
The latest HRRR still shows it dissipating as it approaches.
Posted Sunday 06/22/25 @ 9:14 AM — The Canadian Meteorological Center (CMC) announced their release this week of their advance into AI weather models with the release of an experimental global model based on the GDPS. (GDPS-AI) . The CMC describes this new model as “spectrally nudged” towards an AI model. (Weather models use wave-form physics (spectral methods) to recreate the atmosphere structure and dynamics.)
The GDPS-AI is run twice daily, 00z and 12z and becomes available four hours and 45 minutes after it is run. It forecasts out 240 hours. The nice thing about this AI model: it has hourly forecasts through forecast hour 84, in contrast to the European and US AI models that forecast at 6 hour intervals.
My experience with the Canadian models has found their regular models tend to bias towards the high side of temperatures in this region during the summer months.
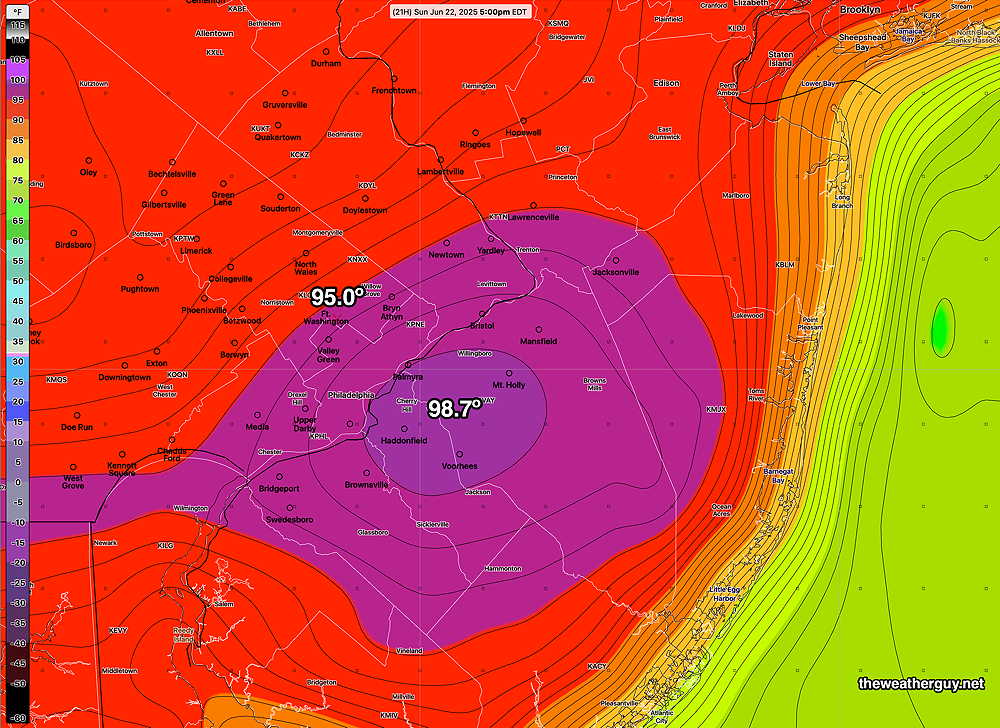
So let’s do an ‘experiment’. Let’s see if their AI version is forecasting temperatures that are too high today?
00z GDPS AI model temperature forecast for 5 PM today, Sunday. (Click on image for a larger view.)
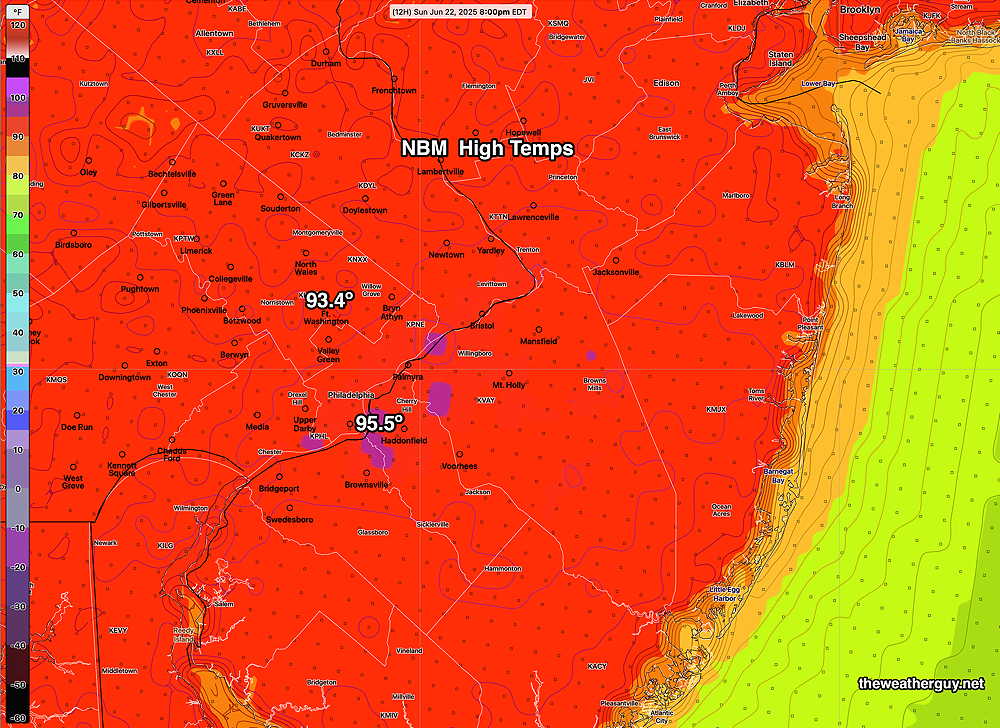
Here’s the latest NBM model, just available. Its highs are significantly less, but the temperatures have a wide uncertainty (standard deviation) of ± 2.2º (The NBM (“model blend”) is a weighted average of 30-40 models)
Today’s 12z NBM high temp forecast. Contour lines are 1 degree increments. The Temps are statistical means, ±2.2º (Click on image for a larger view.)
It wouldn’t surprise me if the NBM is more accurate today, assuming adding 1º-2º to to its forecast.
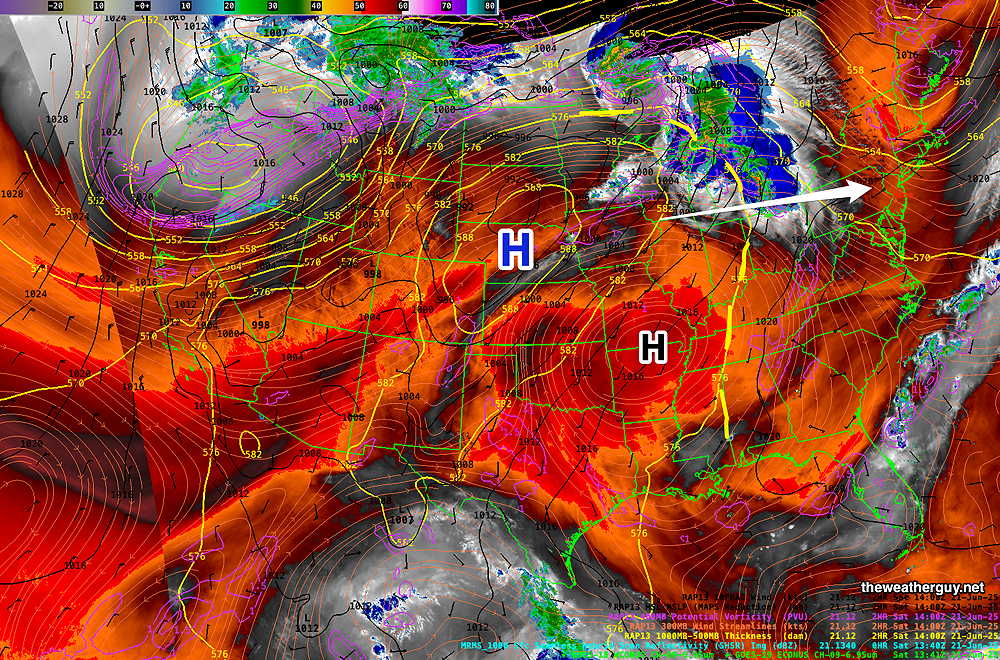
Originally Posted Sat 10:28 AM —The main weather feature of this weekend and much of next week will be a building upper level ridge, bringing very high temperatures and humidity to the Philadelphia region. The building ridge is visible on this morning’s water vapor image—
Current satellite water vapor image with superimposed RAP model 500-1000 mb thickness lines (yellow), Mean Sea Level Pressure isobars (black contours) potential vorticity (fine violet contours) with superimposed MRMS RADAR. Water Vapor Imagery reveals emitted water vapor infrared based on TEMPERATURE, NOT REFLECTED LIGHT from CLOUDS. As a result, Water Vapor Temperatures indirectly reveal height, called the “effective layer” of the water vapor in a region, therefore revealing the mid and upper level 3D contours of systems.. Colder temperatures (blue- grey – white) indicate higher altitude, sometimes revealing upward motion. Red- orange indicates warmer temperatures and a lower height for this layer. There are several water vapor “channels”; the one I display here is called the mid level height channel. (Click on image for a larger view.)
The expected temperatures based on the European AI model (the ECMWF-AI Single) were posted yesterday. When the temperatures here are hitting 100º, I don’t see that much value, (and only hype) in giving the heat indices.
According to the latest NBM, high temps will hit 90º today, Saturday near the city and 97º onSunday.
When the temperatures get this hot, there’s always the possibility of an isolated thundershower popping up. A trigger is often needed for these to occur. The models show some storms in far northeastern PA later this afternoon.
Yet with the upper atmosphere being so hot, the upper level heat in many ways inhibits convective rainfall.
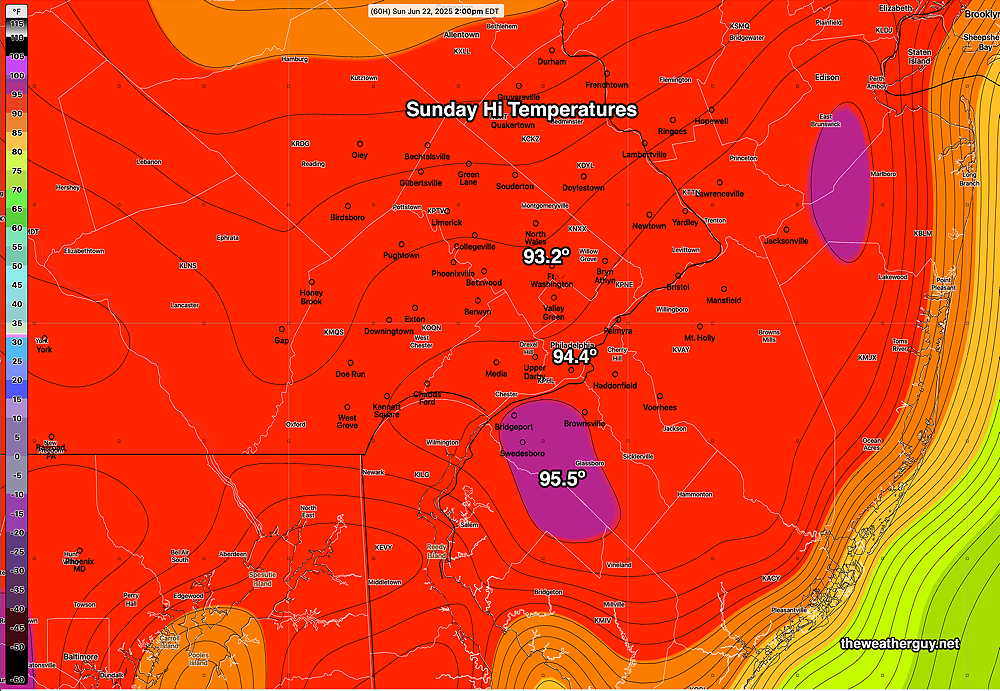
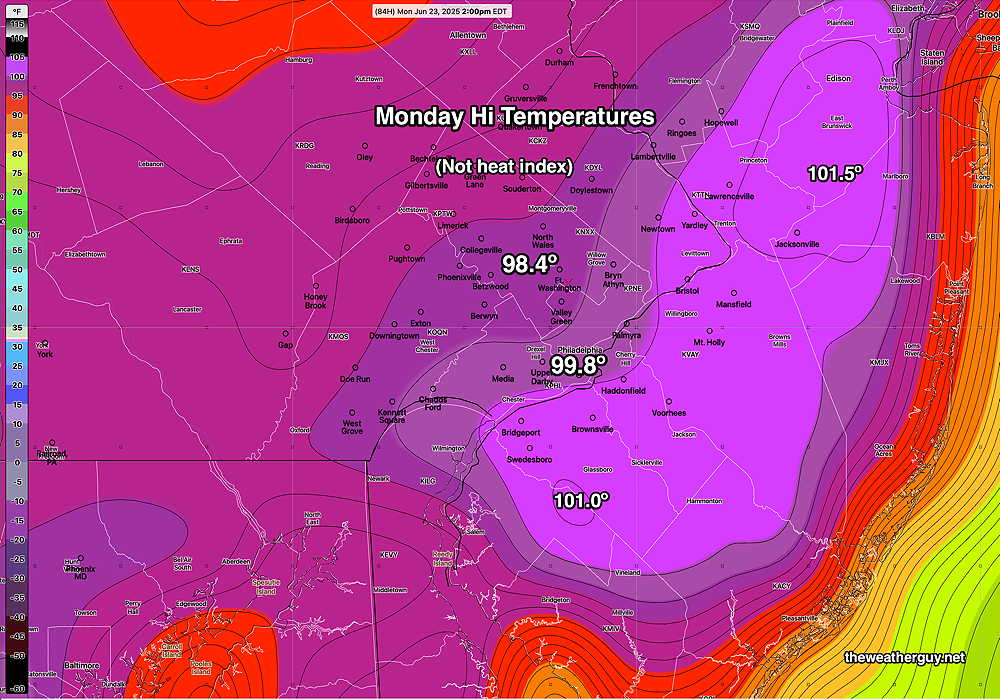
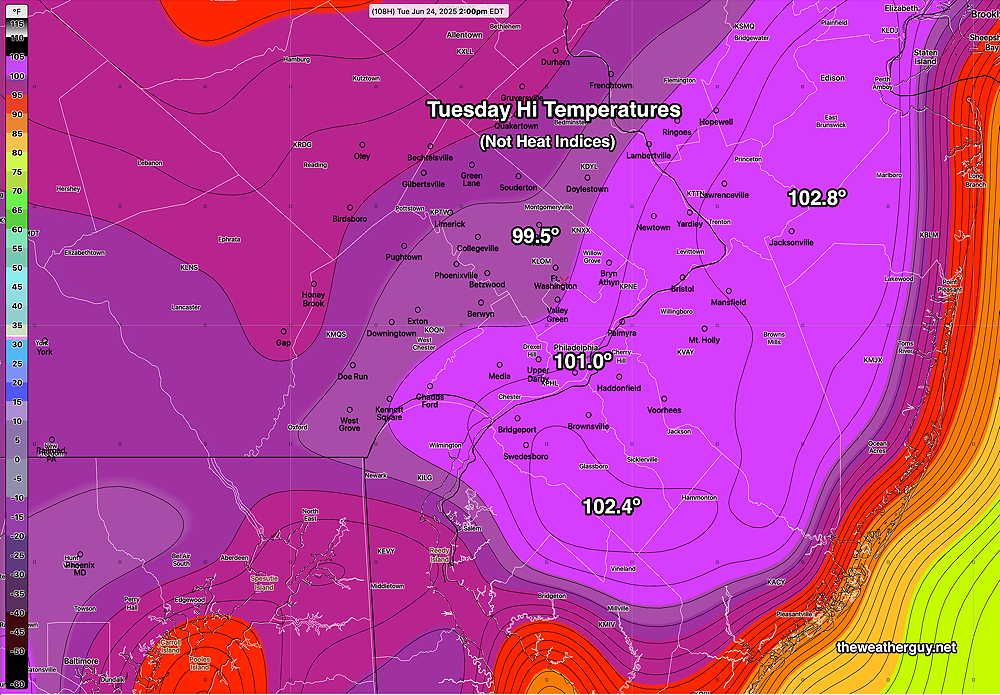
Posted Friday 06/20/25 @ 8:29 AM — Increasing temperatures and high humidity will be the big story for the next six days. The European AI model has been very good with high temperature forecasts and here’s a sample for Sunday, Monday and Tuesday—
ECMWF-AI Temperatures at 2 PM. Contour lines are 1º increments Actual highs, which occur at 3-4 PM may be higher. (Click on image for a larger view.)ECMWF-AI Temperatures at 2 PM. Contour lines are 1º increments Actual highs, which occur at 3-4 PM may be higher. (Click on image for a larger view.)ECMWF-AI Temperatures at 2 PM. Contour lines are 1º increments Actual highs, which occur at 3-4 PM may be higher. (Click on image for a larger view.)
These are actual forecast highs at 2 PM. Since the ECMWF-AI data that I access doesn’t include temperatures at 3-4 PM, the actual likely daily high may be even higher. Since the TV people like to sensationalize with the heat indices, add about 5-10º to get the “apparent temperature” or heat index. Frankly, I don’t know the difference between 100º and 110º; neither is too comfortable.
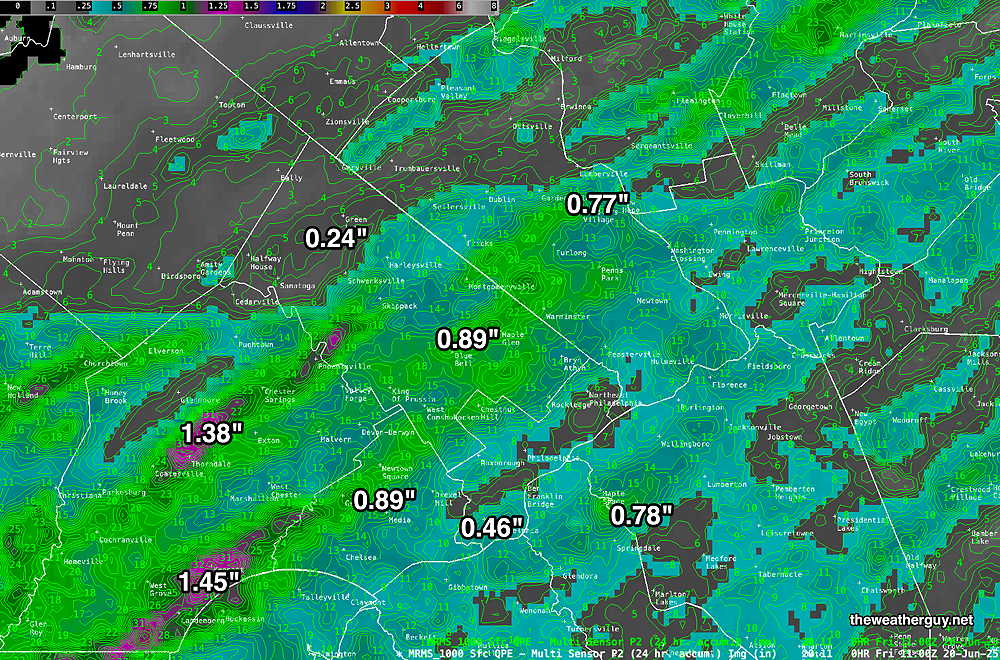
Fri 8:24 AM —Forecast Review —High wind gusts were the main “feature” of Thursday evening’s storms, resulting in power failures. I watched as a the top of tree split off at the far end of our backyard. Rainfall amounts were only in the moderate range, as these storms were fast movers.
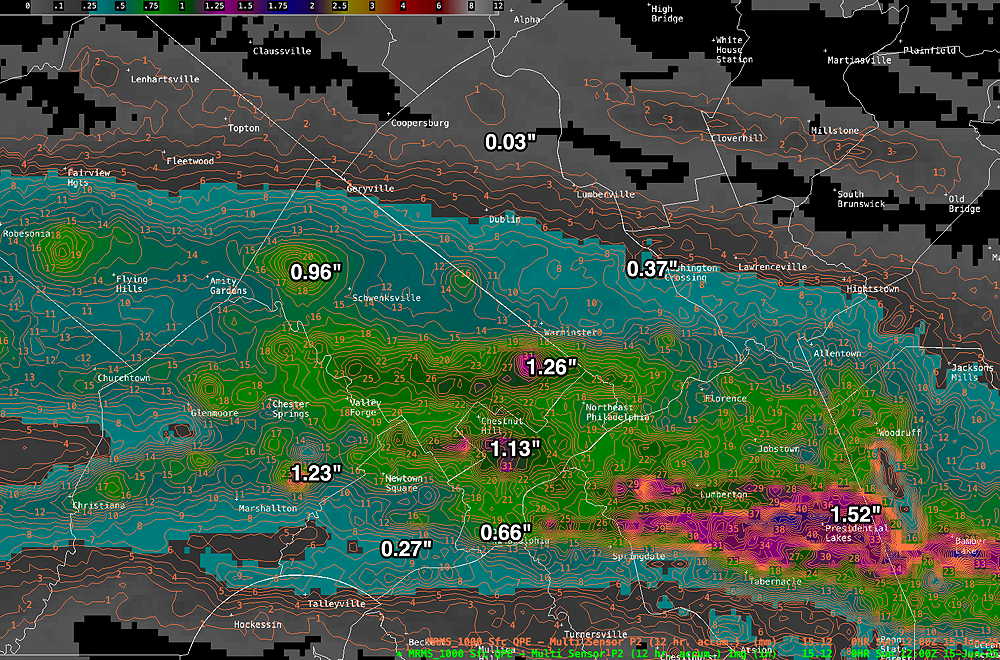
Here’s the MRMS precipitation estimate—
MRMS rain-gauge measured rainfall combined with rain-gauge calibrated and interpolated radar-based summary of ACTUAL RAINFALL RECEIVED. Color shading is in inches. Line contour numbers are in mm. (25.4 mm= 1 inch) (Click on image for a larger view.)
Thursday’s Storms
Posted Thursday 06/19/25 @ 5:04 PM — The storms are moving in on schedule. There was a radar signal for hail in Lancaster county with these storms, but not present at the current moment.
Radar and satellite water vapor with RAP model vertical motion at 850 and 250 mb superimposed. The yellow contours show plenty of upward motion that was missing in yesterday’s storms. (Click on image for a larger view.)
They are fast moving and there may be additional showers later this evening.
Posted Thursday 06/19/25 @ 1:33 PM — A quick update. Additional models show likely severe weather that includes the immediate Philadelphia area, but still more likely just south, in Chester and Delaware counties into South Jersey. Timing still 5:30 PM ± 1.5 hours.
Posted Thursday 06/19/25 @ 10:07 AM — I wanted to wait for a few of this morning’s models to become available before posting today.
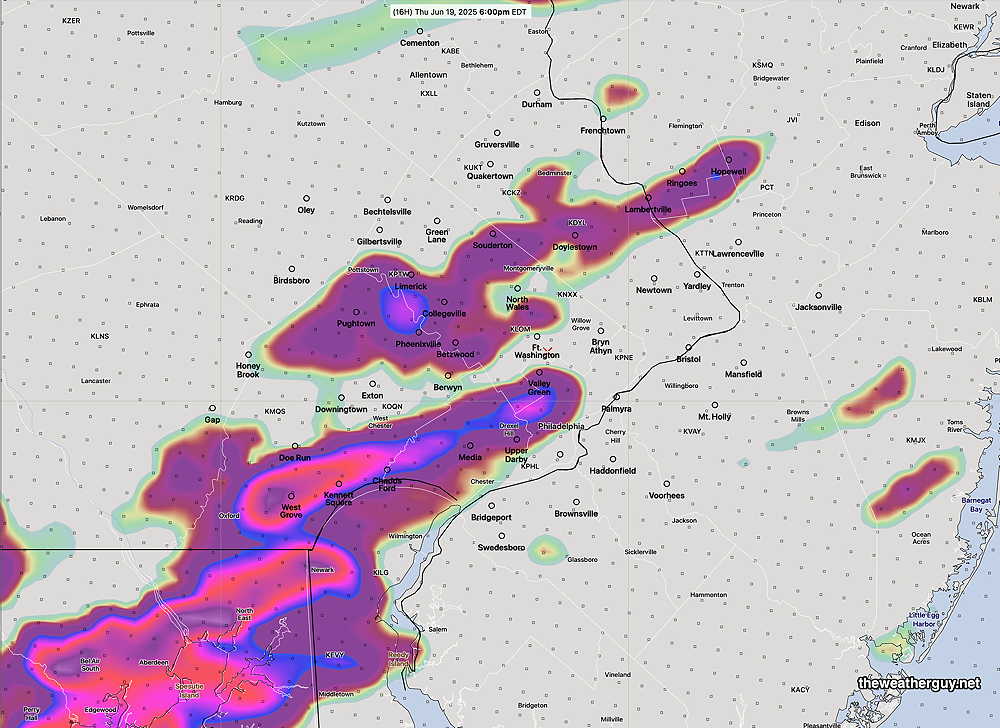
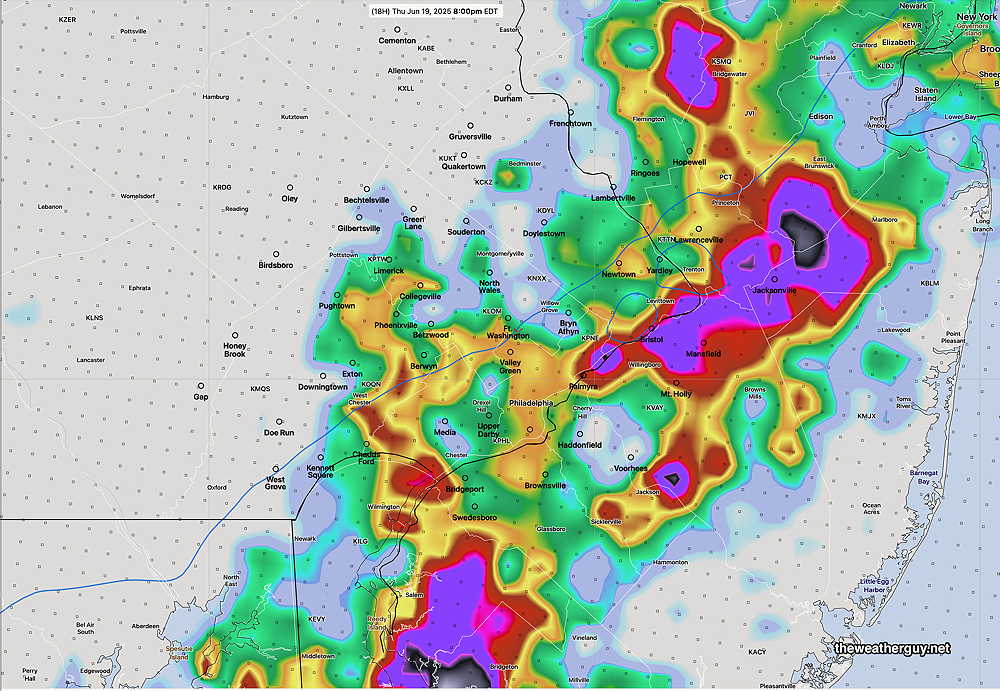
A cold front approaches with showers and thunderstorms likely. For Philadelphia, the peak time time is 5:30 PM ± 1.5 hours. Several models are suggesting that the heaviest activity will occur just south of Philadelphia and into South Jersey.
06zHREF forecast for “maximum upward helicity”, a severity parameter, at 6 PM.
There are several signs that suggest a pattern reminiscent of last summer where the heaviest rain misses the city and its immediate suburbs.
HREF forecast of “echo tops”, the estimated height (strength) of thunderstorm clouds at 8 PM. The black areas show heights of 44,000 feet, suggesting heavy-severe storms. (Click on image for a larger view.)
We’ll have to see if that occurs.
Wed 5:54 PM —Forecast Review The severe storms did not develop as expected. Why?
The strong wave in the upper atmosphere was balanced out by strong downward motion in the lower third of the atmosphere.
Upward motion at the jet stream level (250mb)( was “neutralized” by downward motion at 5000 feet (850mb) (Click on image for a larger view.)Strong wave at 10,000 feet (700 mb) (wavy blue contour) . (Click on image for a larger view.)18z HRRR shows strong upward motion (violet) at 250 mb while strong downward motion at 850 mb (yellow) counteracted the strong wave. (Click on image for a larger view.)
Wednesday Storms
Posted Wednesday 06/18/25 @ 8:56 AM — Trying to determine where and when storms will develop today is like trying to decide where the first bubble will form at the bottom of a saucepan bring brought to a boil.
We have some general cues. The storms will be widespread, but a few areas may not see anything. There’s plenty of “juice” (energy) available with some models showing CAPE values as high as 3000 joules/kg. (very high). The “precipitable water” values are tropical with amounts as high as 2.7″ (extreme).
Most likely time is anytime from 1:30 PM to 6 PM with highest probability in the 4 PM to 6 PM time slot.
10z Hourly RRFS shows the heaviest rain in NJ. However, exact location is never a strong suit for weather models. (Click on image for a larger view.)
The latest hourly HRRR shows storms in the over the immediate Philadelphia area, while the latest hourly experimental RRFS shows the heaviest storms just over the river in NJ about 4-7 PM. Any storms will have extremely heavy rainfall. There will be some sunshine by late morning and early afternoon in many (but not all) areas. Any sunshine will fuel the already unstable atmosphere.
Wednesday into Thursday
Posted Tuesday 06/17/25 @ 7:41 PM — A warm front with showers and some thunderstorms is expected to move through our area later this evening into early Wednesday morning. The current radar shows the showers more eastward at this time than any of the model forecast—
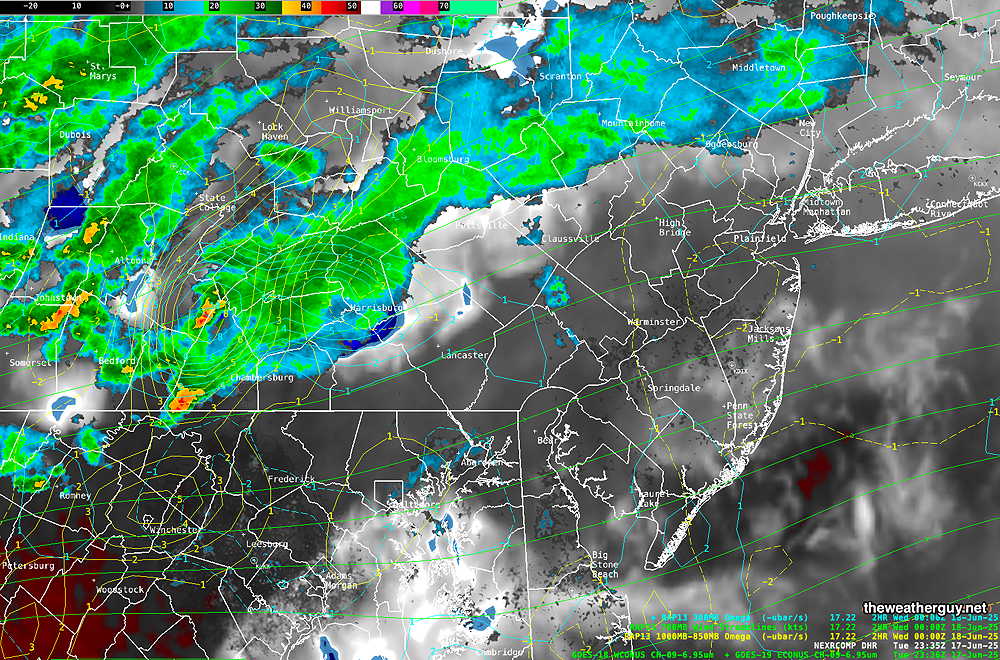
Current conditions Water Vapor/Composite Radar with superimposed RAP model vertical velocity pressure (Omega- green contours) and 700 mb wind streamlines. Area of rain is about 20-30 miles more eastward than forecast by the models for this time. (Click on image for a larger view.)
Current models have the showers and thunderstorms ending early morning Wednesday, but with a range between 8 AM and 11 AM. Clouds remain for the most part, but some sunny breaks are possible in during the afternoon. Very warm and very humid conditions by the late morning.
Most models have instability showers/thunderstorms develop Wednesday afternoon between 3 PM and 6 PMs as an upper air disturbance moves through. Any sunshine will fuel their formation.
A cold front moves through Thursday late afternoon with more thunderstorms.
Tuesday into Wednesday
Posted Tuesday 06/17/25 @ 8:41 AM — Another cloudy day today. Some showers may break out this afternoon in Berks county but little in the way of showers for most of the daytime hours closer to the city.
A warm front approaches and moves through our area tonight into Wednesday morning. Around or before daybreak Wednesday, we may get some heavy thunderstorm activity that wakes everyone up a bit earlier than they’d like.
GDPS-AI forecast for Wednesday 6 AM. Approaching warm front with showers and thunderstorms. (Click on image for a larger view.)
A very humid day expected on Wednesday with dew points in the low to mid 70s!
Heat and Humidity by Wednesday
Posted Monday 06/16/25 @ 8:28 PM — The latest models reinforce the expected dramatic change in temperature and humidity in store for us. The latest model blend has temperatures approaching 90° 85° with dew points in the uncomfortable low to mid 70s as early as Wednesday. There’s a fairly high probability of heavy thunderstorms late afternoon Wednesday.
Temperatures 98°-100° still expected by next Tuesday.
Forecast Review
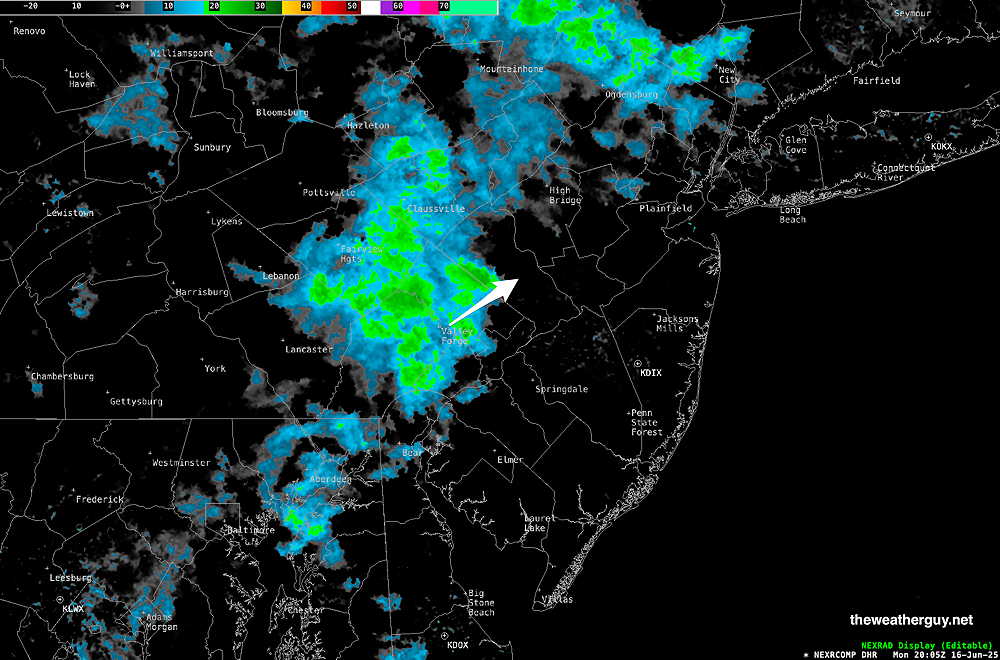
Posted Monday 06/16/25 @ 5:05 PM — The showers forecast to stay well west of Philadelphia this afternoon developed and moved closer to the city than forecast by most models.
Here’s the radar at 3 PM—
NEXRAD composite radar at 3 PM. (Click on image for a larger view.)
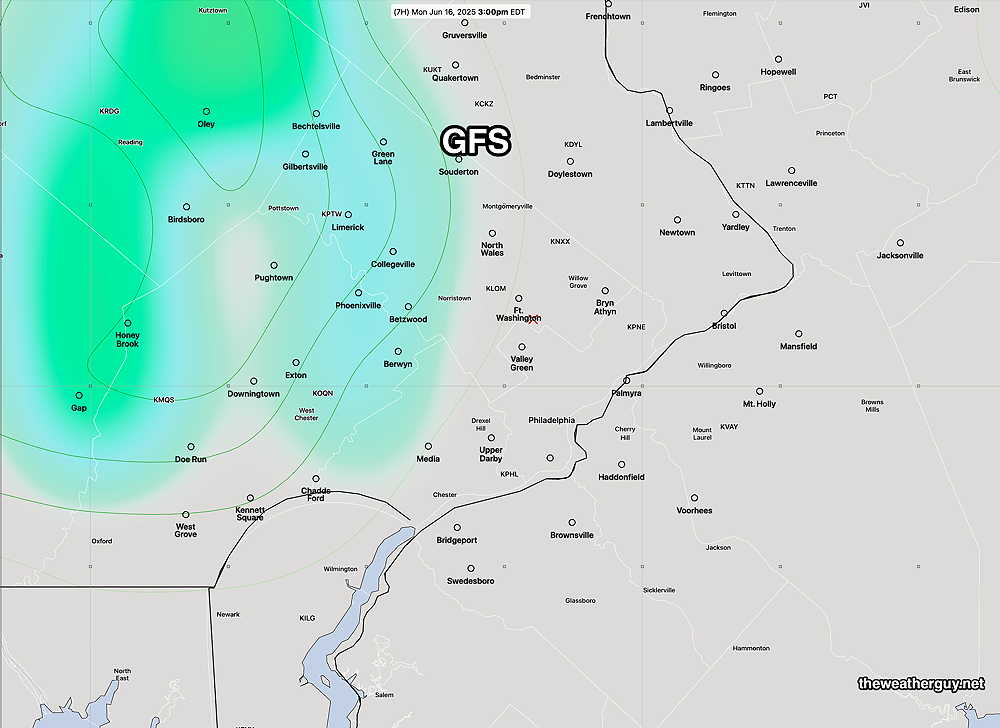
12z GFS forecast rain placement. The light rain was forecast to be in the western suburbs. (Click on image for a larger view.)
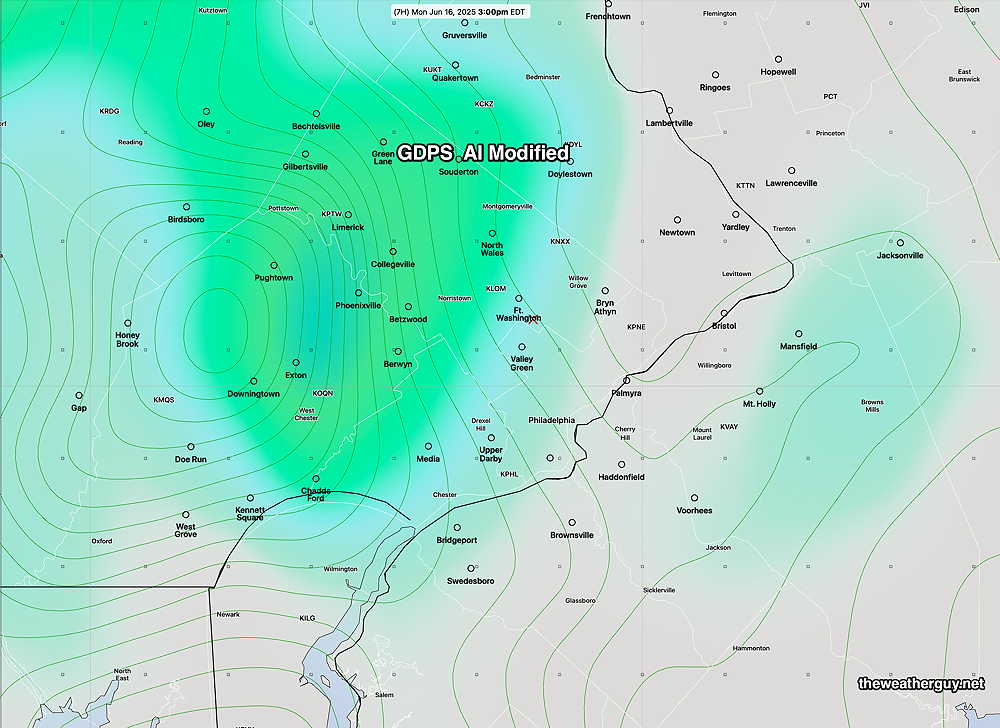
Earlier today, I spoke of the new Canadian experimental AI modified model just released. Here’s its forecast for 3 PM today—
The new experimental Canadian GDPS- AI model did surprisingly well with today’s forecast (Click on image for a larger view.)
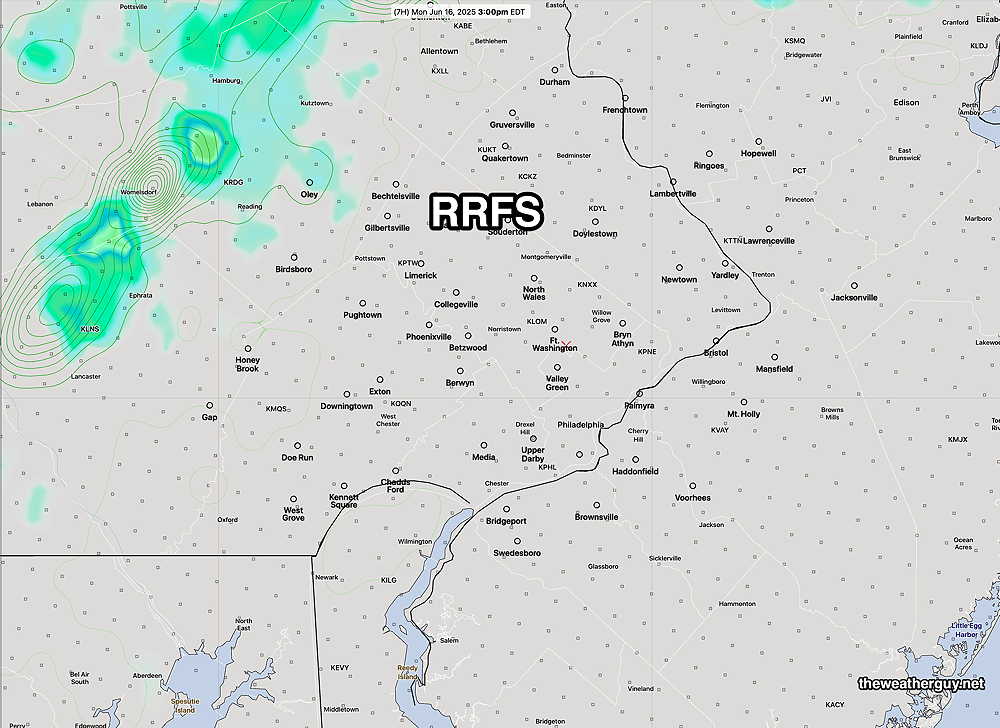
At the other end of the spectrum are the experimental RRFS and REFS models. I’ve held great hope in their release as operational. Unfortunately, they forecast today’s weather very poorly, with virtually no rain forecast in this time period near the city—
12z RRFS forecast for 3 PM today The RRFS forecast was unacceptable. ( Click on image for a larger view.)
They will have to become much better in order to be released. The expectation with the RRFS and REFS is for them to replace and eventually eliminate the NAM, NAM-NEST and HRRR models. I don’t see that being possible with their recent forecast errors. It would be a step backwards.
Transition to Summer Heat
Originally Posted Mon 11:15 AM — The stagnant cold, damp pattern we’ve been in over this past weekend will finally transition to summer and some significant summer heat is expected by early next week.
Current water vapor image—
Monday morning- Current satellite water vapor image with superimposed RAP model 500-1000 mb thickness lines (yellow), Mean Sea Level Pressure isobars (black contours) potential vorticity (fine violet contours) with superimposed MRMS RADAR. (Click on image for a larger view.)
We have a few more days of unsettled weather. Today (Monday) will be cloudy and warmer than recent days. A few showers are possible this afternoon, mostly in far western suburbs.
Tuesday will also be cloudy. A warm front approaches late Tuesday evening with showers and thunderstorms after midnight into early Wednesday morning.
Warmer and more humid on Wednesday with highs in the mid 80s.
A cold front moves through Thursday, also with some showers.
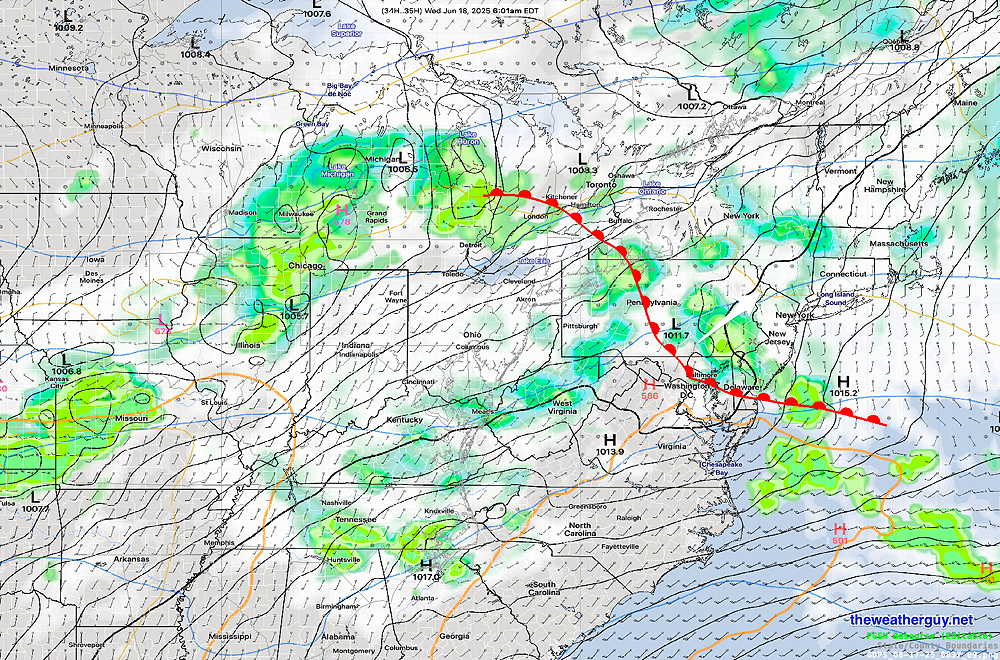
ECMWF-AI forecast for early Thursday morning with an approaching cold front. (Click on image for a larger view.)
Despite the “cold” front, temperatures will quickly warm over the weekend and into next week. Current AI models are predicting 95º-98º by nextTuesday.
The Canadian Meteorological Center (CMC) has recently released an AI -modified experimental (“spectrally nudged”) Global Forecasts Model at 1 hour increments and a resolution of 15 km. The model forecasts out to 240 hours at 1 hour increments up to 78 hours and 3 hour increments from 78 hours to 240 hours. Some upper level parameters are every 6 hours. This experimental model is expected to replace their regular global model, the GDPS (Global Deterministic Prediction System also called the Global GEM), in 2026.
I’ve started working on programming the download and post-processing of this model and I hope to share it here in the coming days.
Posted Sunday 06/15/25 @ 9:35 AM — Last night’s NAM-NEST did well in predicting some of the heavier rain, although more fell in NJ than it had predicted.
Last night’s rain- MRMS (Pass2) rain-gauge measured rainfall combined with rain-gauge calibrated and interpolated radar-based summary of ACTUAL RAINFALL RECEIVED. Color shading is in inches. Line contour numbers are in mm. (25.4 mm= 1 inch) (Click on image for a larger view.)
Very disappointing was yesterday’s experimental RRFS model runs, which showed little to no rain last night.
As for today, little in the way of any rain is expected during the day, although mist, some fog and overall damp weather is expected.
Posted Saturday 06/14/25 @ 8:27 PM —Sunday looks to be mostly cloudy with little in the way of rain in the Philadelphia region, based on the RRFS and HRRR,.
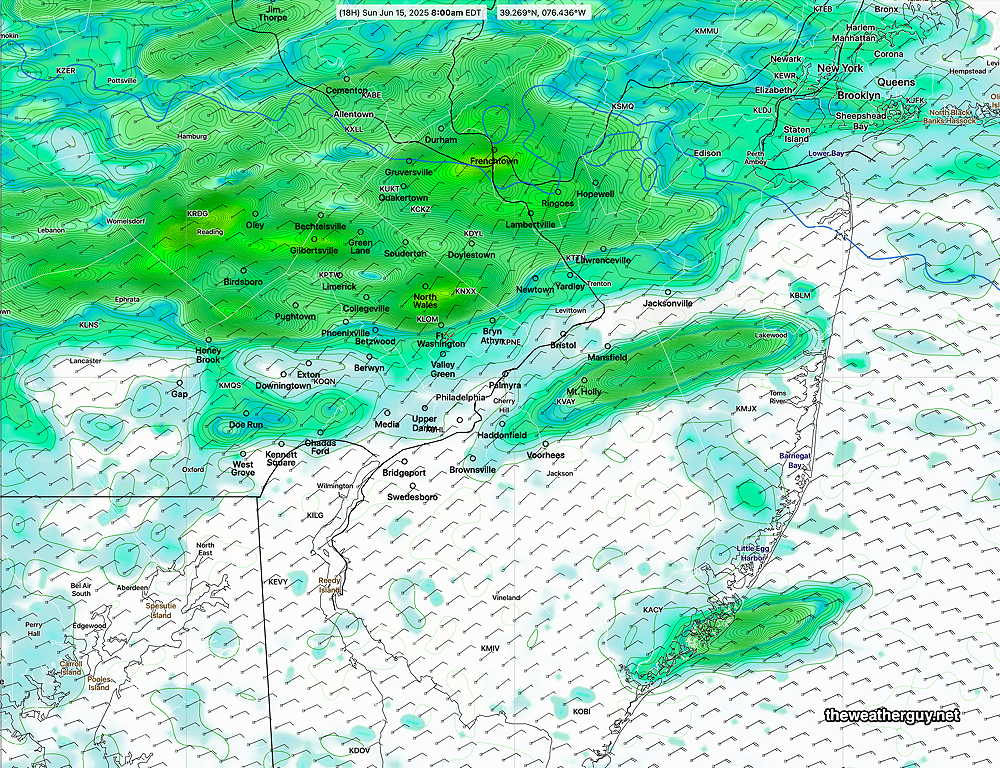
HOWEVER, at the other end of the spectrum is the NAM-NEST which has considerable rain in the morning and widely scattered showers during the day. This evening, the NAM-NEST forecast more closely matches the radar at this time lending credence to its forecast.
18z NAM-NEST forecast for 8 AM (Click on image for a larger view.)
The latest ECMWF-AI model is closer to the NAM-NEST forecast.
So we have much significant uncertainty. As I often say, the most useful forecast is knowing the times when there’s little certainty.
If the RRFS and HRRR are correct, rain is expected to stay to our far north and to our far south. There may even be some breaks in the overcast and bright spots at times, especially in northern sections of the area. If the NAM-NEST is correct, there will be more showers throughout the day, especially in the morning.
Forecast models leaned towards: NAM-NEST ECMWF-AI
Forecast Update
Posted Saturday 06/14/25 @ 9:17 AM — Last night’s 06z models (2 AM EDT) showed a trend towards less rainfall in the immediate Philadelphia area, not too different than the ECMWF forecast posted yesterday.
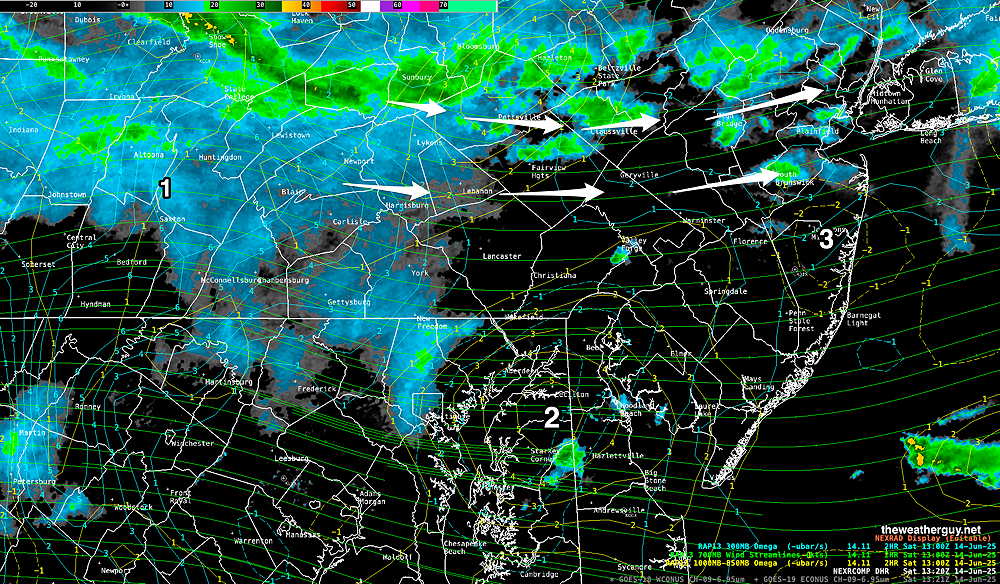
Here’s current radar around 9:30 AM—
Current (~9:30 AM) Composite NEXRAD radar with superimposed RAP model vertical motion (vertical velocity pressure “omega”) at low and higher levels of the atmosphere. Upward motion is supportive of precipitation; downward motion is inhibits precipitation. Green contours are 700 mb (10,000 ft) wind streams. Areas 1 and 2 are upward motions, area 3 is downward (inhibitory) (Click on image for a larger view.)
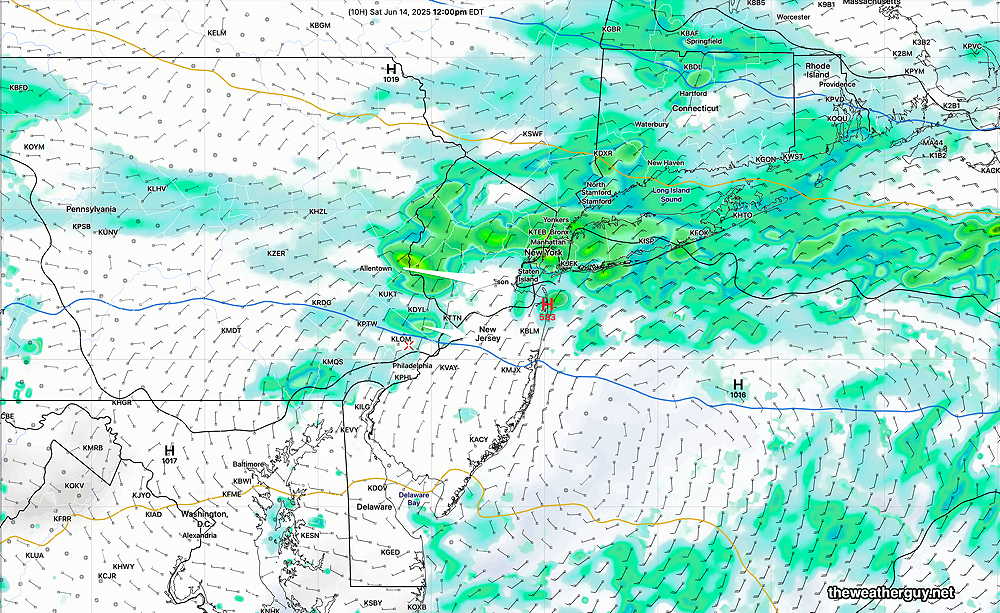
Both the HRRR and experimental RRFS show this trend. This general trend has been consistent with some, but not all of the models. Here’s the 06z RRFS—
06z RRFS forecast for noon. Only light precipitation in our area. Most of the heavier rain stays to our north.
It should be noted that the Canadian HRDPS shows much heavier rainfall here around mid day. For now, we’ll ignore the HRDPS forecast.
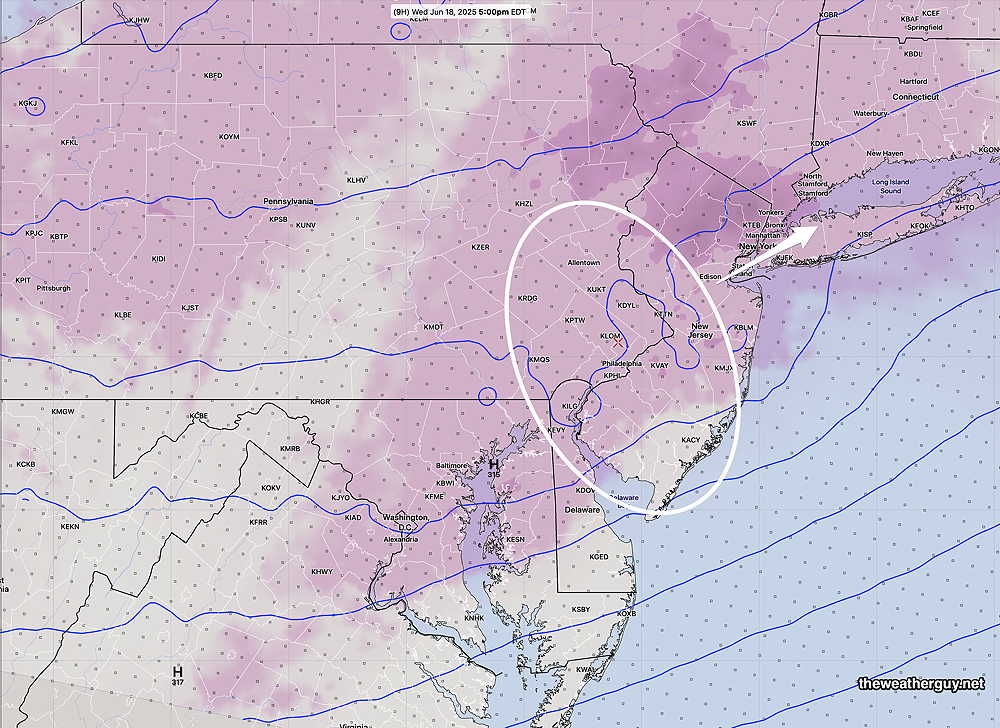
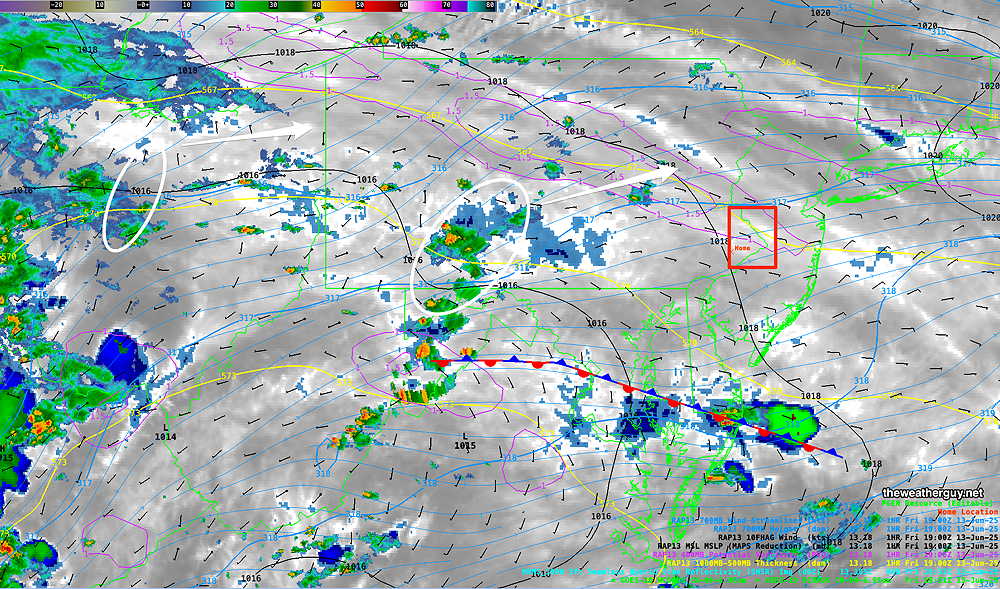
Previously Posted Fri @ 5:53 PM —A cold front has dropped south of our area today and become stationary. An easterly flow of cooler (but somewhat damp) air has moved into the region. The water vapor image from this afternoon captures the current scenario—
Satellite water vapor image from mid afternoon with superimposed RAP model 500-1000 mb thickness lines (yellow), Mean Sea Level Pressure isobars (black contours) potential vorticity (fine violet contours) with superimposed MRMS RADAR. I’ve drawn the approximate location of the stationary front. Waves of low pressure will move near this stalled front over the weekend. Periods of showers are expected now, both Saturday and Sunday, but it won’t be raining the entire time. (Click on image for a larger view.)
I should point out that the amount of sunshine we had today was greater than predicted by several models, and it sets into question whether the the current pattern is being properly modeled.
I’m going to provide several graphics of model forecasts at 2 PM Saturday to illustrate the wide range of rain coverage.
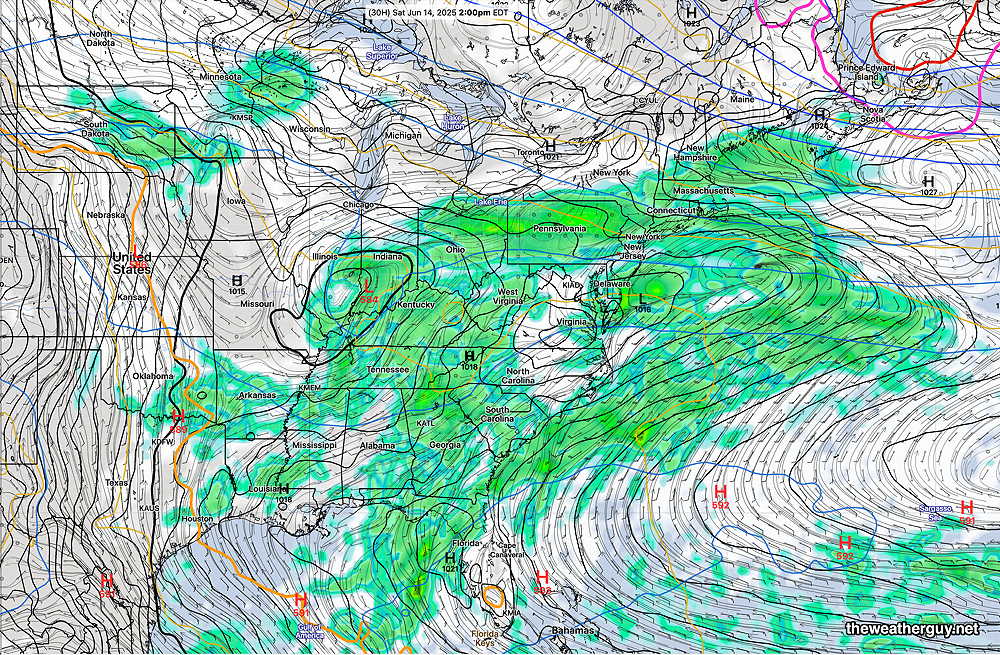
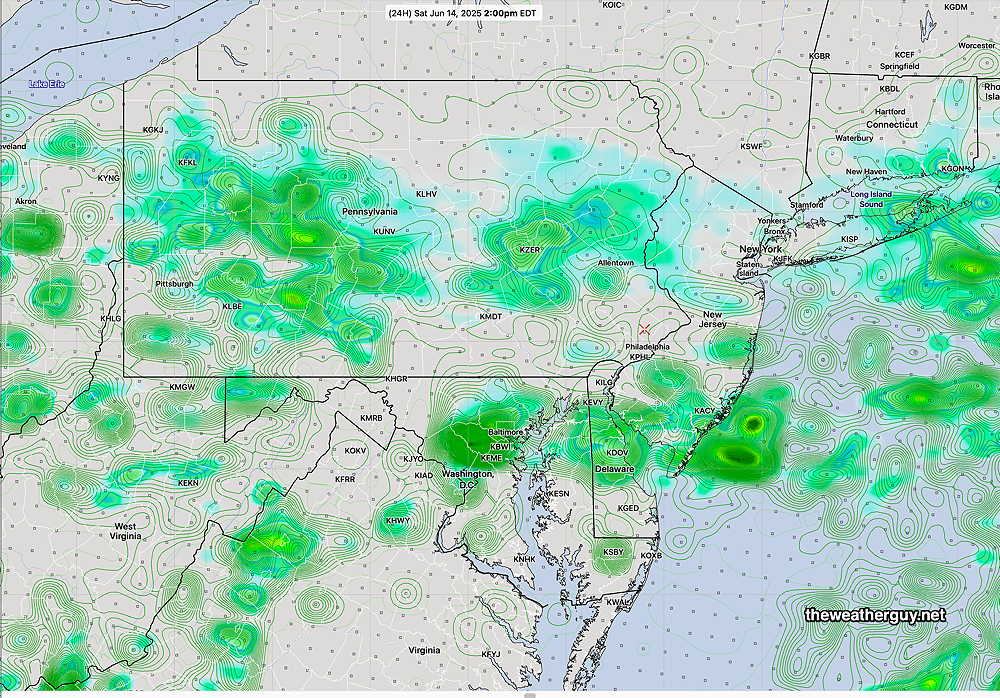
The most recent GFS forecast for 2 PM Saturday captures the extent of the rainfall, but I think it’s relatively low resolution suggests more rain than will actually fall.
Todays 12z GFS forecast for 2 PM Saturday. (Click on image for a larger view.)
A similar resolution ECMWF captures the more intermittent coverage of the rain—
12z ECMWF forecast for 2 PM Saturday. (Click on image for a larger view.)
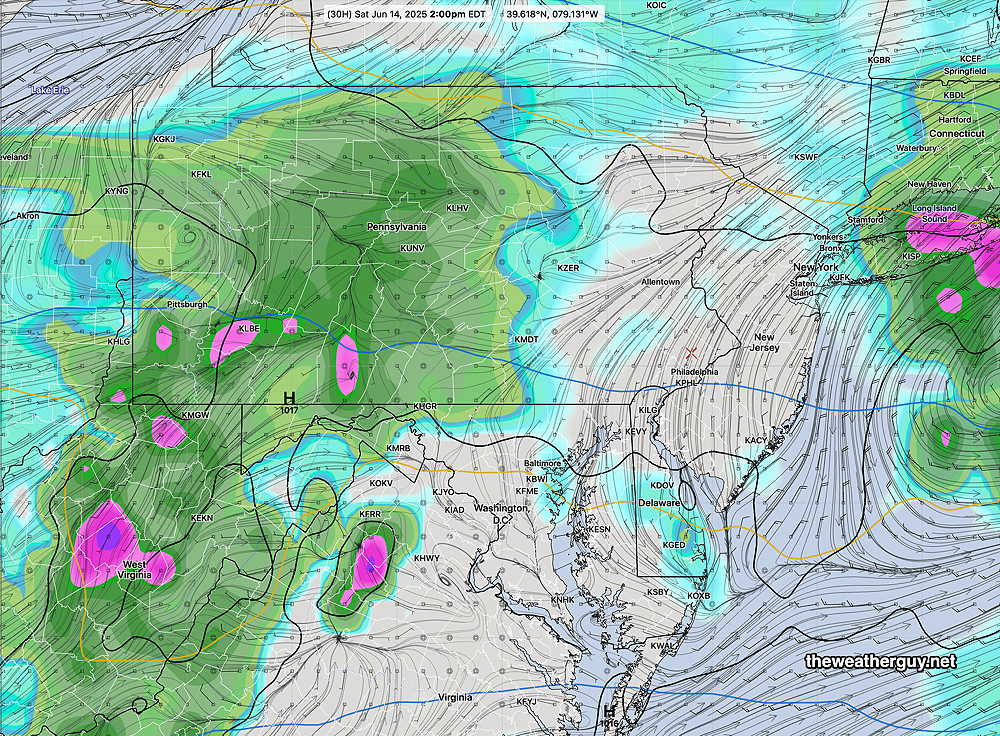
The much higher resolution HREF model captures the more intermittent nature of the rainfall—
18z HREF model forecast rain and statistical spread (contours) for 2 PM Saturday. (Click on image for a larger view.)
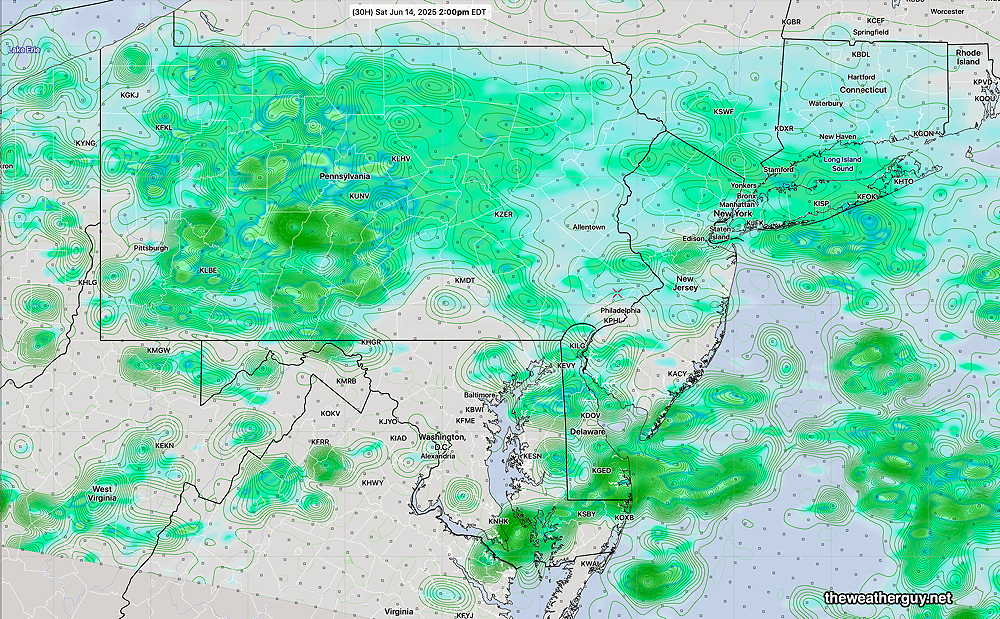
Finally, here’s the latest REFS (experimental) model forecast for 2 PM Saturday.
12z REFS forecast for 2 PM Saturday. Rain and statistical spread (fine contours) (Click on image for a larger view.)
From all of these models, it should be apparent that there’s a wide range of rainfall coverage for Saturday, and with the exception of the GFS, the Philadelphia region and South Jersey appear to get the least rainfall.
Saturday Forecast
Cloudy with periods of showers throughout the day. Rain won’t be continuous and there should be breaks in the action. Fog and mist possible.
NBM high temperatures: Blue Bell, PA 69º Philadelphia, PA 71º High uncertainty (based on standard deviation): ± 3.6º
Sunday Forecast
Cloudy with intermittent showers. Rainfall not as widespread as Saturday with plenty of breaks in the showers.
NBM high temperatures: Blue Bell, PA 67º Philadelphia, PA 68º Low Uncertainty (based on standard deviation): ± 1.3º