Category Archives: Commentary

WHAT THE MODELS GOT WRONG…

The computer modeling of this storm had many aspects go wrong…

  • The original track, consistently a near coastal storm for many days, became an inland storm.
  • The precipitation start time in Philadelphia, shown by most models to be 3-5 PM, didn’t start until 6-8 PM.
  • Thermal profiles, due to dynamic cooling and modeling error, allowed more snow than predicted before the changeover.
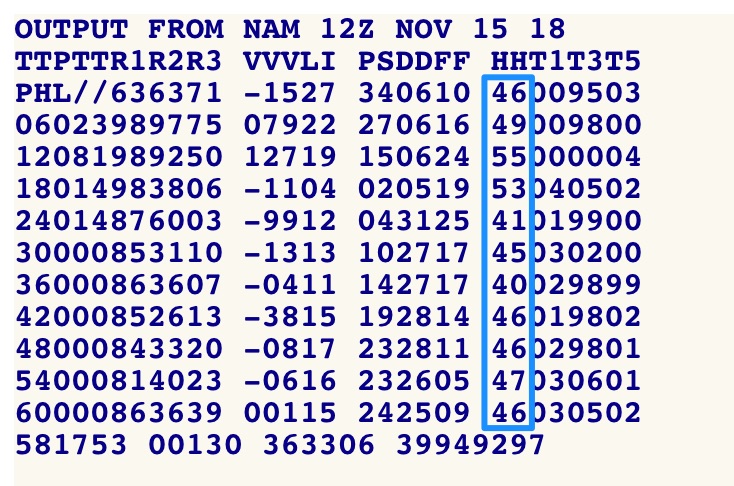
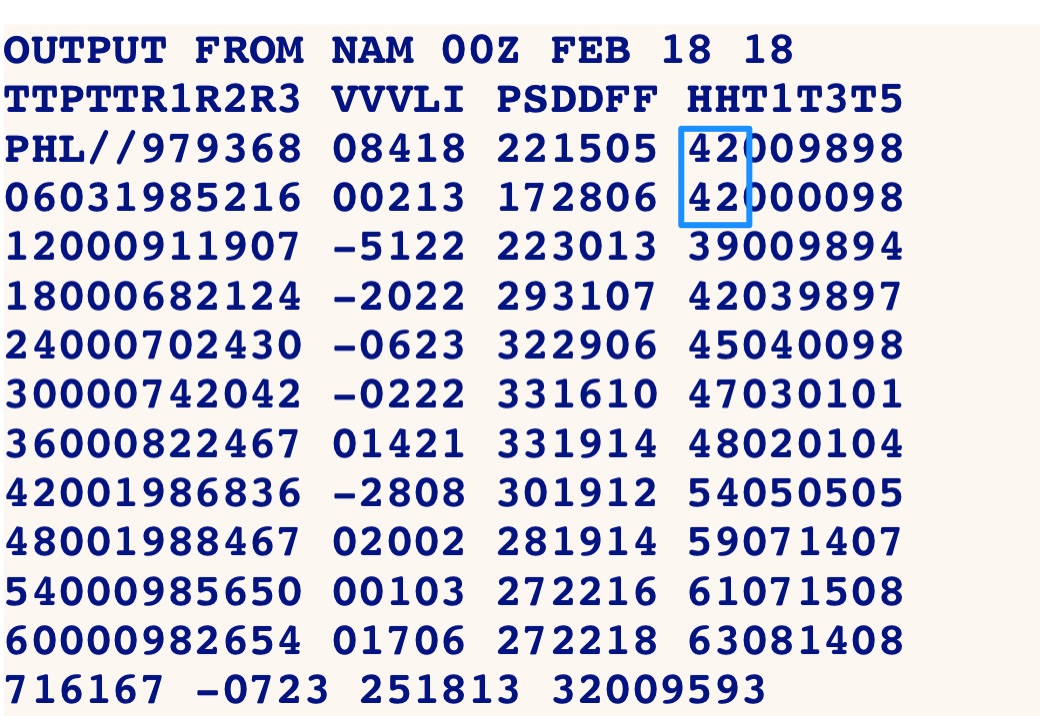
  • Temperatures that were expected to rise rapidly into the 40s shortly after midnight didn’t reach 40 until 6 AM today.
  • High temperature today of 49-50 (GFS) was never reached.
  • Winds that were supposed to pick up during the night and this morning, didn’t happen (yet.)
  • Winds are so light now that fog has developed in many areas, also unpredicted by the models.
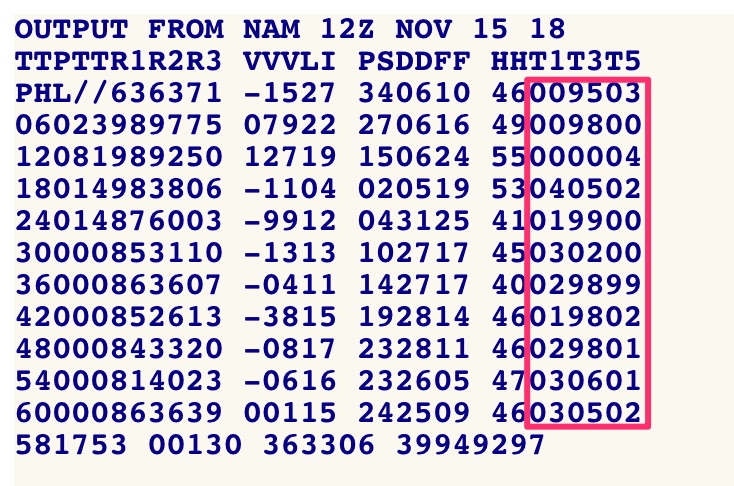
  • Temperatures, predicted to rapidly drop to freezing by 1-2 PM, are now predicted to be in the 40s until noon!

With this storm, it’s not that one model did better than another. The GFS, NAM and NBM (the NBM is a composite of many models, including the European, Canadian, GFS, NAM, their statistical analogs, and the HRRR) all got it wrong.

Flash freeze?   I don’t think so.  “Flash Freeze” warnings became its own TV weather reality show when it was realized that this was going to be just a rain storm.  Originally based on model runs from early Thursday and predicated on a originally predicted temperature drop from about 49 to 32 in just a few hours, current short range models now show an unremarkable drop in temperatures during the afternoon today.  But the Flash Freeze likelihood has been dispelled by the model runs for two days.

The models are still showing high winds (likely) and a cold snap for later this afternoon and tonight.

[su_note note_color=”#d9f2da”]Current temperatures are running warmer than even this morning’s models. It’s 43 northwest of the city at 11 AM, but the NAM run from this morning predicted 36.

The NBM is looking the best right now- temperature drops to 32 about 3-4 PM and 5 degrees by Monday morning.[/su_note]

SO HOW DID MY FORECAST GO BAD?

With high certainty today, I had made a forecast for an immediate switch to sleet and rain.  I blew it.   I feel I have an obligation to explain why the forecast went wrong today.

I’m going to get technical but I’m also going to share some of my secrets for winter weather forecasts in Philadelphia.  (It’s the least I can do to make up for the forecast error!)

First, I prefer the NAM model for precipitation type. I use that model almost exclusively for snow storms but also use the GFS for QPF and other things.

With the NAM, there is something called FOUS data (Forecast Output Statistics).  It’s a form of  tabular data that’s been available for years, even when the NAM was previously called the ETA.

The FOUS data allows a quick and incredibly powerful way of looking at a forecast for a single area, six hours at a time.

Here’s the FOUS data from this morning’s NAM model run for PHL. (I’ll explain the boxed in numbers in a moment)  —

The data is tabular and somewhat coded to allow different data to be shown using two digits in each column.  The rows are 06-60 are six hour increments, starting here at 12Z (7 AM EST.)

Those who read my forecasts know that I put a lot of emphasis on upper atmospheric temperatures vs lower atmospheric temperatures. One way of estimating upper level temperatures is atmospheric “thickness” between near surface and 500 mb (18,000 feet).  It’s called the 500mb thickness. (The Boxed column above.)  It works out that this thickness is an indirect measure of density and temperature in the upper levels.  As the thickness gets higher, the average temperature in the upper atmosphere is higher.

In Philadelphia, at or near sea level, the critical 500 mb thickness  (rain vs snow) (which relates to density and ultimately temperature) is 5400 decimeters.

In FOUS data, the 5 is dropped and the last zero is dropped.   In the FOUS data, 5400 dm , the 500 mb critical thickness would show in this column as 40.

Let’s cut to the chase:   When the thickness is above 5400 (40)  in most cases, it’s usually too warm to snow in the upper atmosphere.  Today it showed 46-55!

I rarely see any exceptions to this, although it did cause a forecast error last season:  We had snow last season, (4 inches) even though the FOUS thickness was 5420 (42)-

February 18 2018 FOUS  We had snow with Thickness above 40


So, what happened today?

Here again is today’s FOUS, now with the lower atmosphere temperatures boxed.  The actual temperature columns are at 1000, 800 and 900 mb. (the lower atmosphere.)

Today’s FOUS with temperatures

These temperature numbers are also ‘coded’.  Here, 98 means -2 degrees celsius. So, you can see that the NAM forecast shows the lower levels at or below freezing until sometime late afternoon, (when the last number goes to 04).

[su_note note_color=”#d9f2da”]So the reason for the poor forecast- with the 500 mb thickness at 46-49, I thought it was a straight-forward forecast of too warm to snow today. (Or to use a common expression, “too big to fail”. LOL).

It works most of the time, but not today. Today, the temperatures in the lower atmosphere called the shots. [/su_note]

I’ve shared how I approach the last grouping of numbers which is a summarized way of viewing the 3D temperature profile- thickness and temperatures and precipitation type.

As I write this note (1:45 PM) , the snow is changing to rain!  I knew it was going to happen eventually.

I guess the NBM is doing well!