#Philadelphia #weather #PAwx #PhillyWx
Wednesday and Wild Weather Thursday
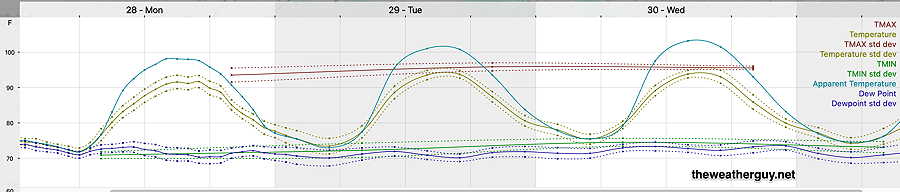
Posted Wednesday 07/30/25 @ 9:41 AM — With temperatures close to the highs reached on Tuesday, but with humidity (dew points) possibly higher, today (Wednesday) will be very hot again. Here’s the latest 12z Model Blend (NBM) just available—
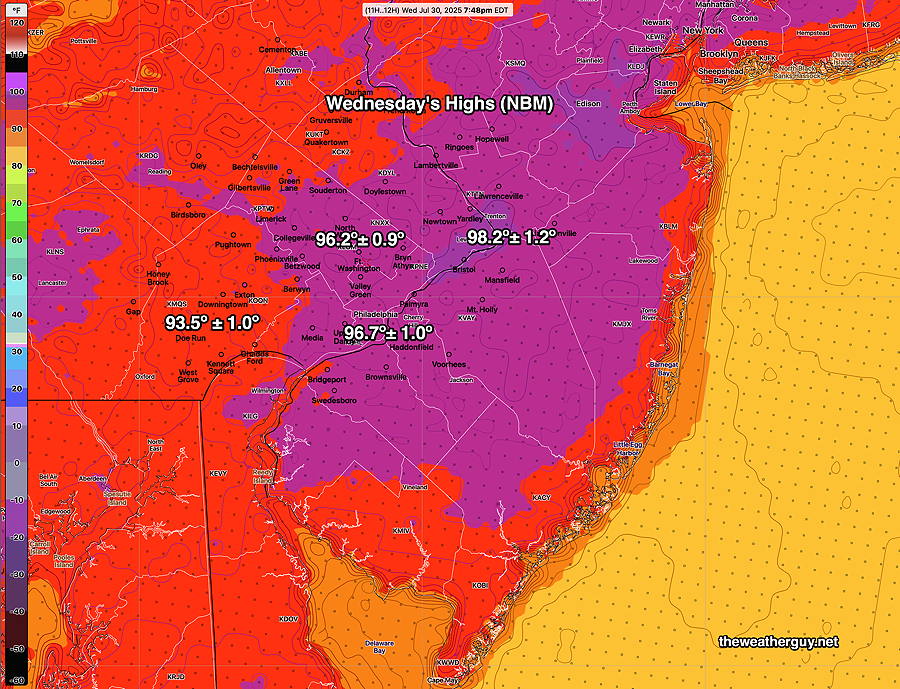
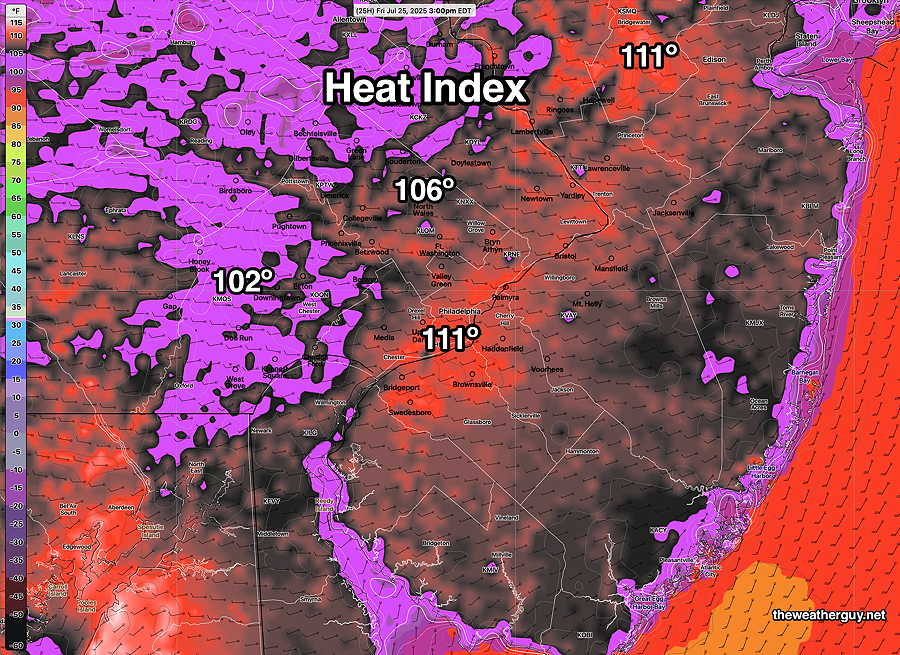
Apparent Temperatures (Heat Index) will be in the 101º-105º range, peaking about 2:30-3 PM.
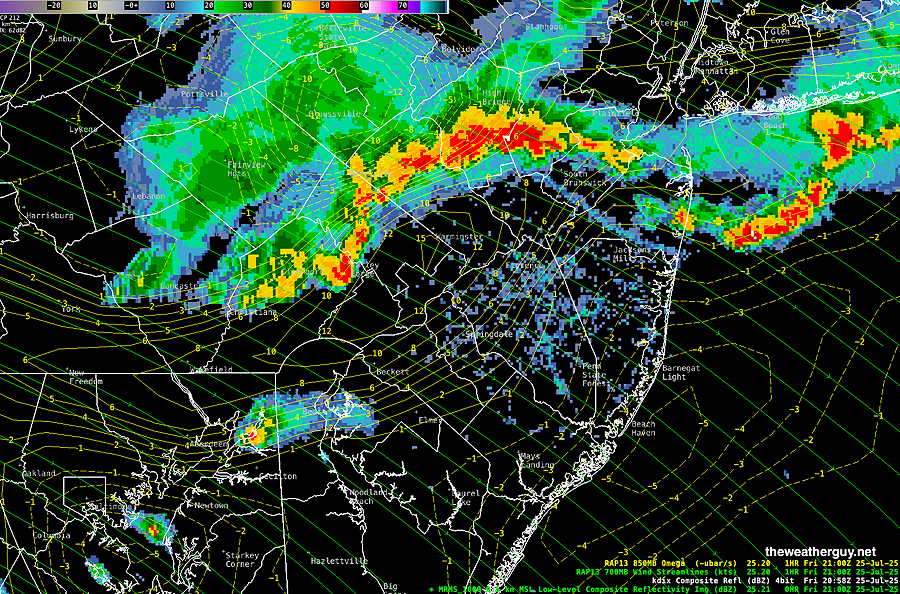
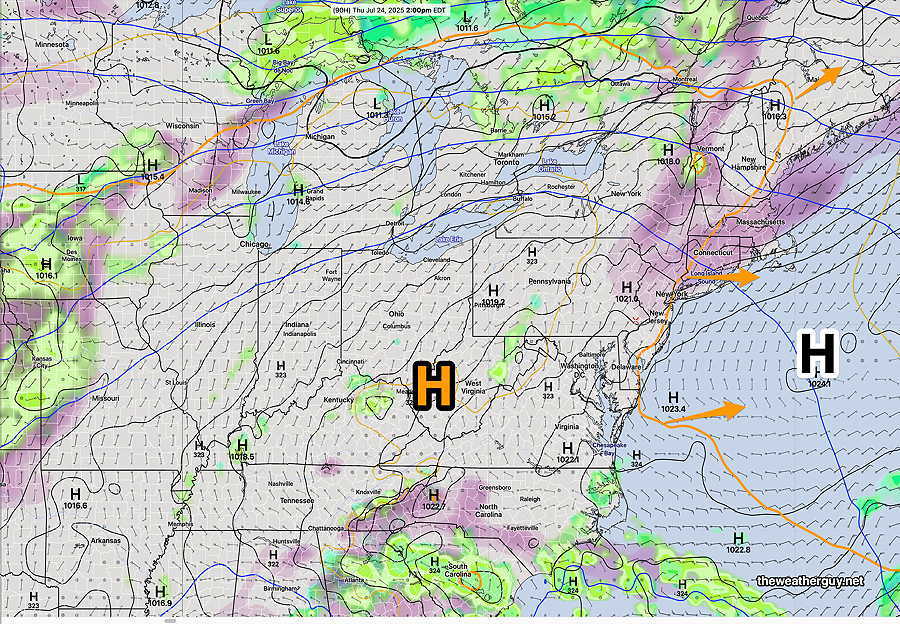
As for Thursday, a cold front will approach. There are signs that severe weather will be a possibility. Timing is currently 2-7 PM. Thunderstorms will be most numerous about 4:30 PM-6 PM. This timing may change.
Specifically, the NBM hourly “tornado probability” parameter is registering in the 1.2% range for the immediate PHL area. That may not sound very high, but on previous days this entire season, its value hasn’t exceeded 0.1% in our region. So it’s 12x higher than previous days this season. Stay tuned.
Tuesday Forecast Review & Wednesday Outlook
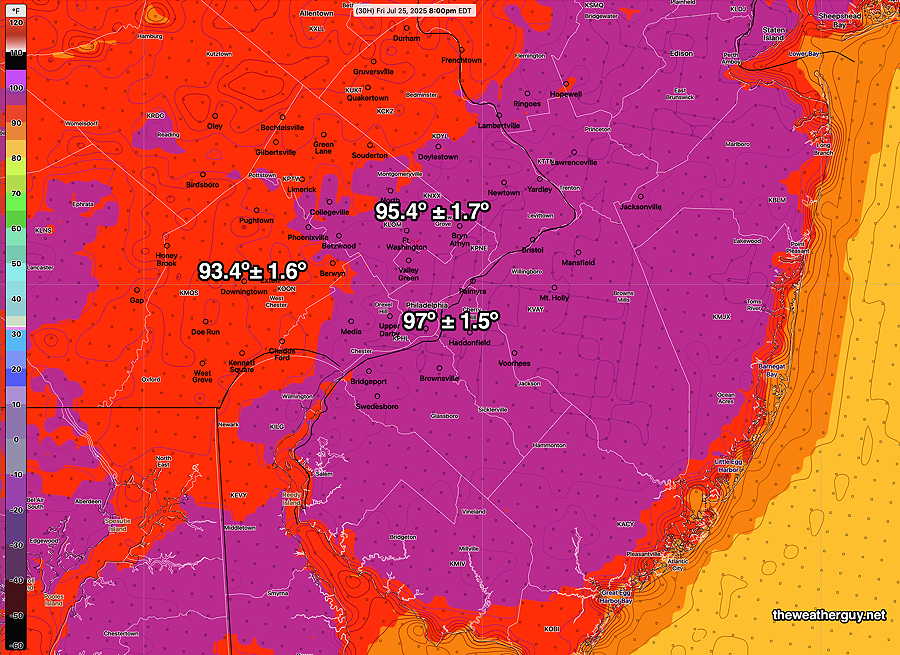
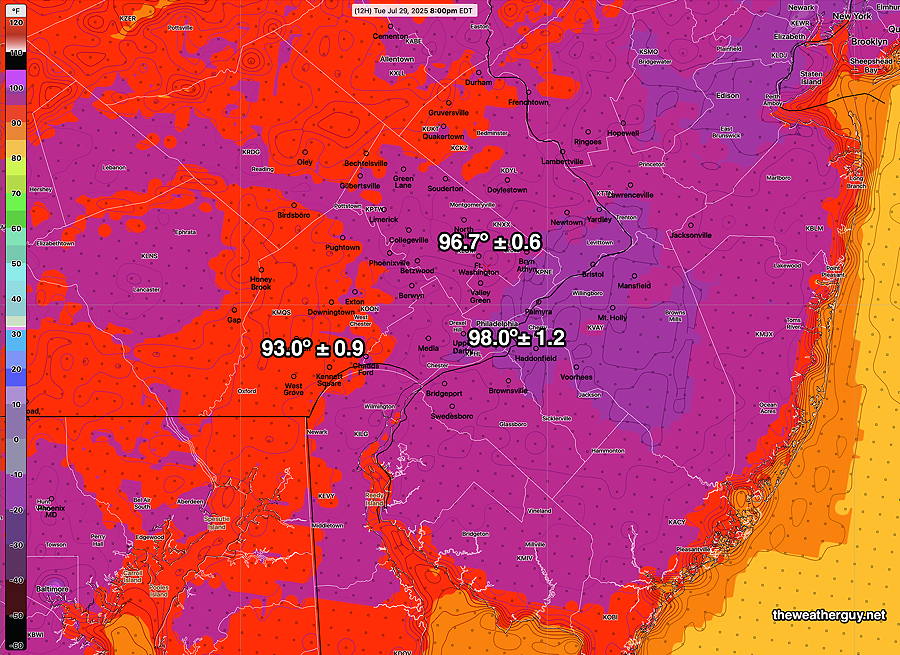
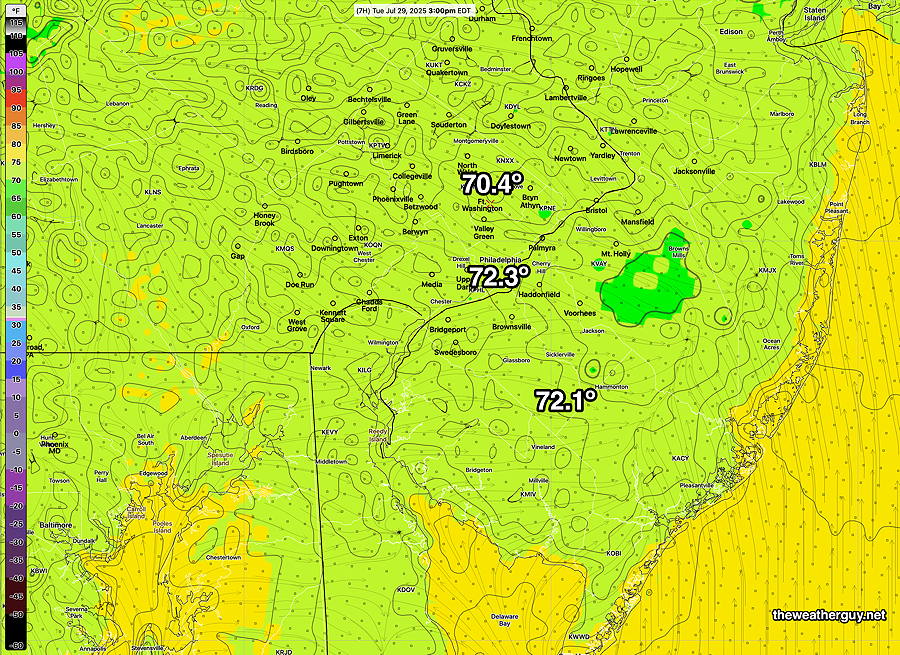
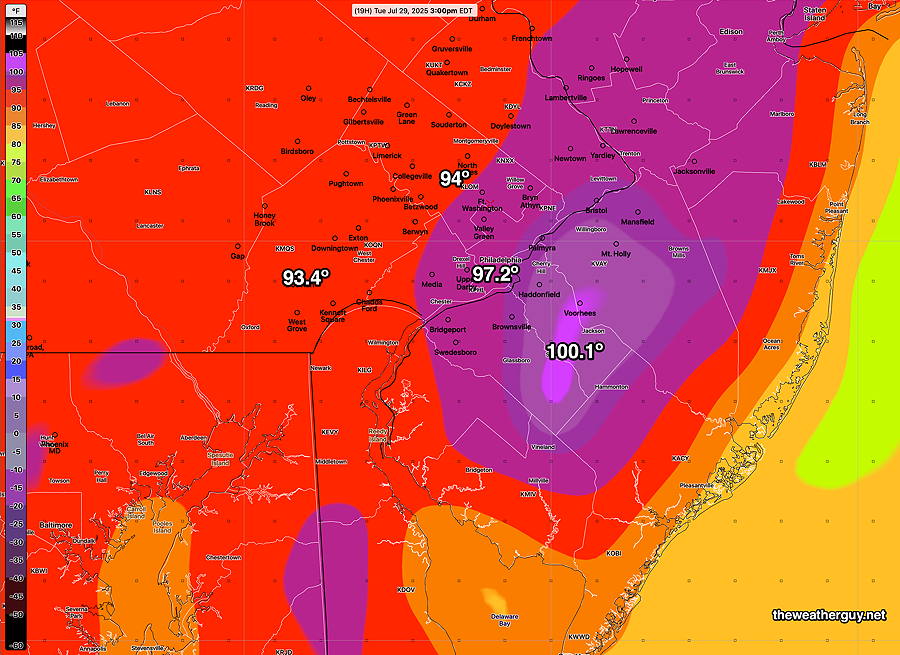
Posted Tuesday 07/29/25 @ 5:18 PM — Well, the high at Philadelphia airport was 98º about 3:54 PM and the dew point was 70º. (The transient 99º will likely be ignored.)
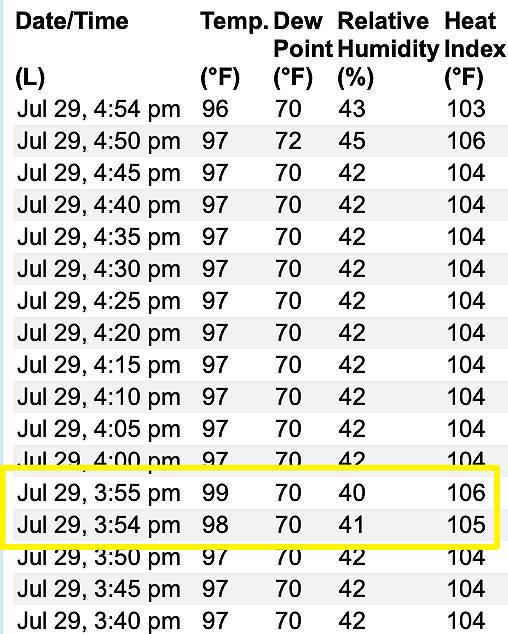
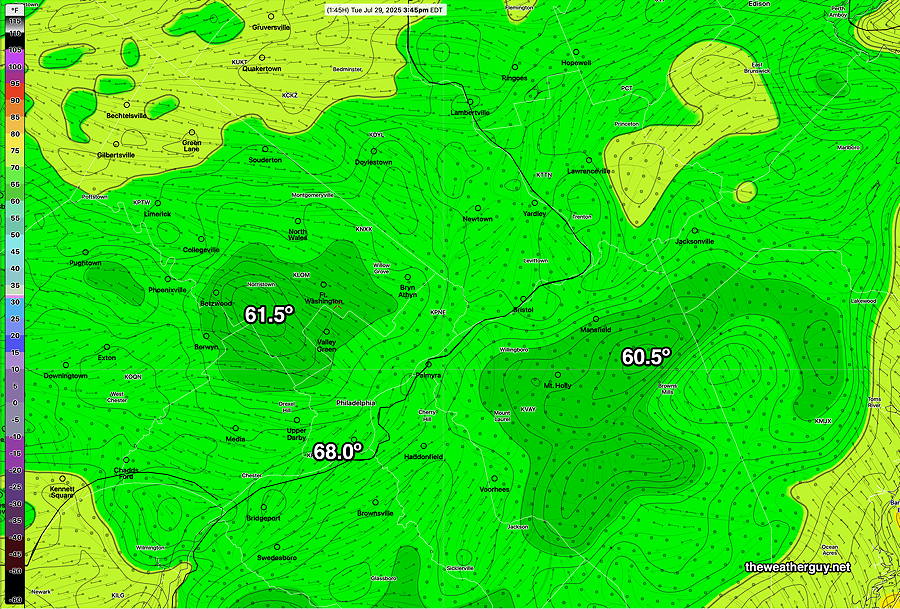
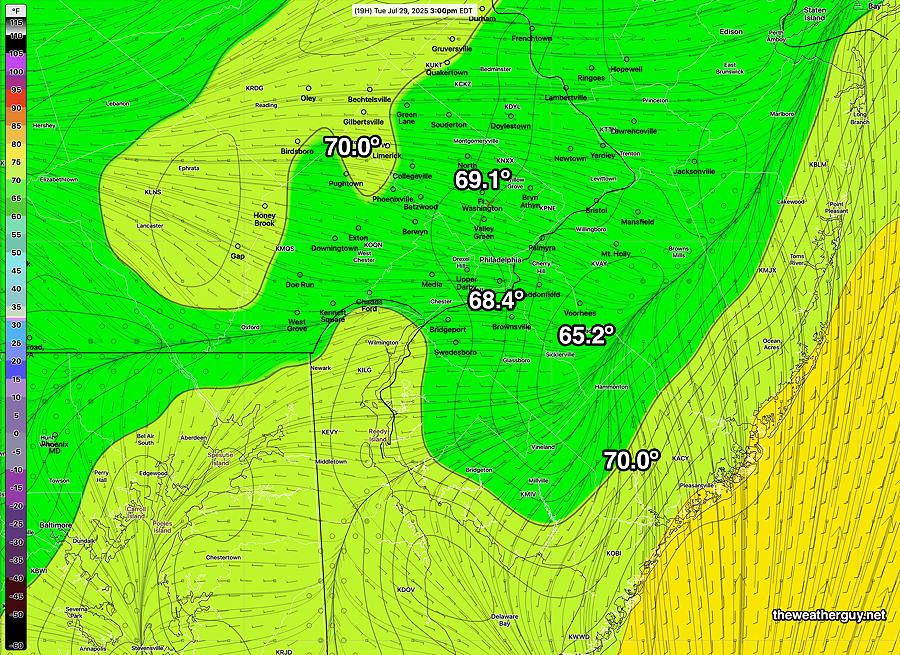
What’s interesting is the RTMA, at 3:45 PM (runs every 15 minutes) shows the same temperature 97 as the official record, but lower dew points.
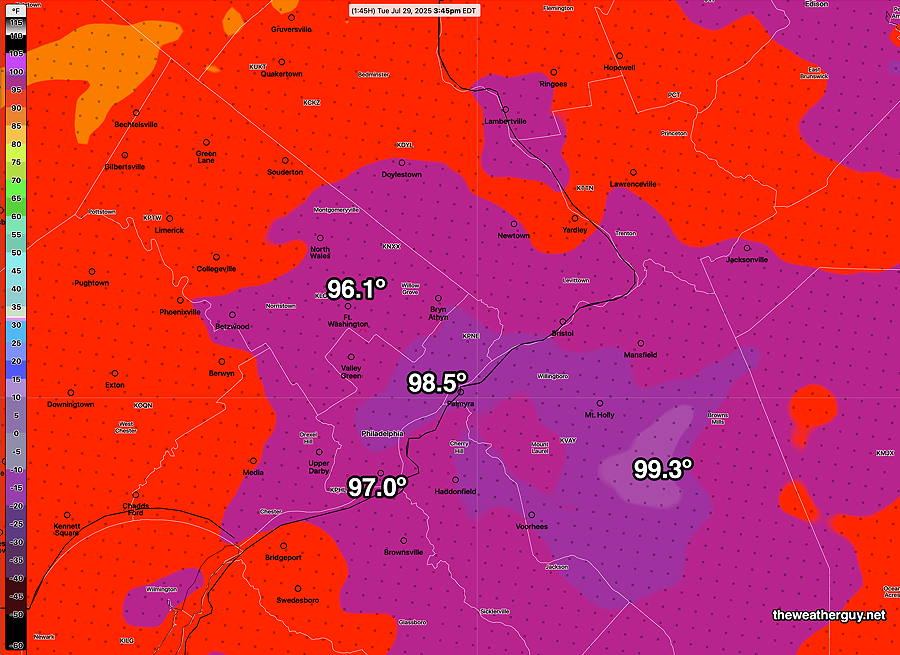
RTMA dew points at 3:45 PM
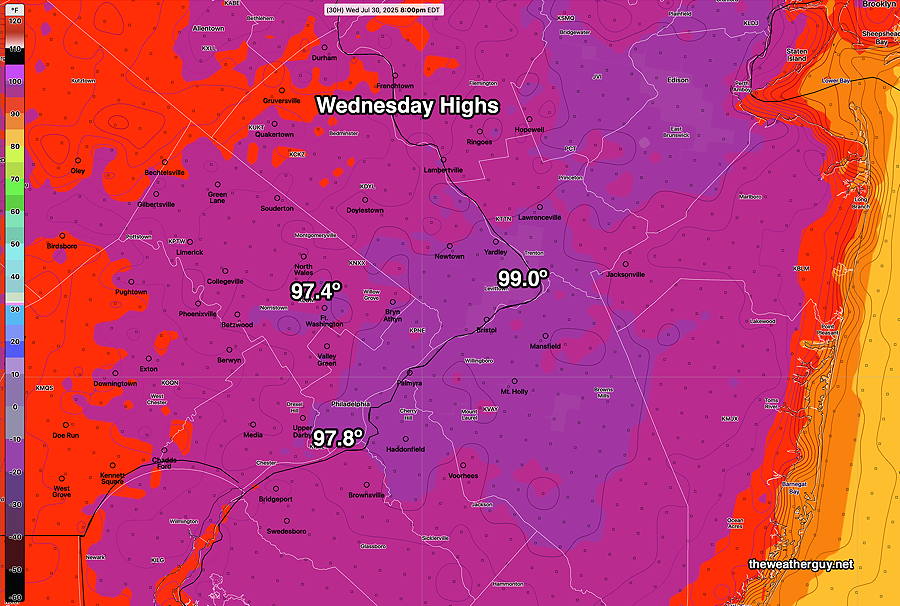
Here’s the forecast highs for Wednesday (NBM)
Tuesday Heat
Posted Tuesday 07/29/25 @ 9:32 AM — Today, we’ll likely see temperatures reach areas that are very hot, but I would still reserve the term “extreme” for actual temperatures in excess of 100º.
The latest NBM forecasts dew points that are likely (possibly) too high—
Today’s deterministic numerical models, particularly the NOAA models, keep the dew points in the 70s. However, the AI models have the dew points falling into the upper 60s after noontime, which will keep the over-hyped “Heat Index” or “Feels Like” temperatures lower.
The AI models were correct in yesterday’s dew point forecasts.
As I said yesterday, it’s not unusual to have dew point temperature forecasts be inaccurate, and that’s a reason why “Feels Like” temperature forecasts can sensationalize and be inaccurate since “apparent temperature” forecasts depends on the forecast accuracy of two parameters, humidity and temperature, not just one.
I won’t be posting the NBM “Apparent Temperatures”, aka “Heat Index”, since today’s forecast dew points are a bit on the high side.
Yesterday’s experimental Canadian GDPS with “AI Spectral Nudging” did particularly well in its temperature forecast. Here it is for today—
Here’s the GDPS-AI dew point temp forecast for the same time, 3 PM—
Monday
Posted Monday 07/28/25 @ 4:02 PM — I didn’t want to say this, but this “heat wave” seems just a bit over-hyped by the media. Today’s dew points were significantly lower than had been forecast resulting in heat indices that were lower as a result. It’s summer, it’s 93º.
If actual temperatures were approaching 100º, I could understand the use of “extreme” in the forecasts , but..
Here’s the official data from PHL airport—
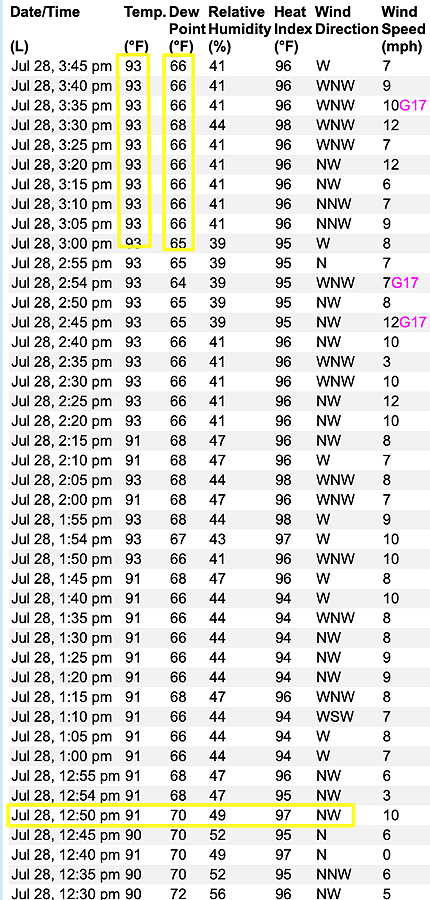
(Click on image for a larger view.) Source: https://www.weather.gov/wrh/timeseries?site=kphl
That said, actual temperatures are expected to be higher on Tuesday and Wednesday. But it’s not unusual to have dew point temperature forecasts go wrong and that’s another reason why “Feels Like” temperature forecasts can sensationalize and be inaccurate to boot.
BTW, over past years, I’ve been asked which is my favorite weather app for mobile. Many of them are quite ok and I don’t use any particular one.
I really use my mobile web app (Safari) and and I really like this official web site for local conditions: NWS IDS Forecasts
For live radar, I like something that’s truly live. Many of the apps are delayed images. I’ve subscribed to WeatherTap for over 26 years. They’re not cheap, but I like their radar images on the go.
Adding to that, I use a this for current conditions in nearby official sites—
https://www.weather.gov/wrh/timeseries?site=kphl
https://www.weather.gov/wrh/timeseries?site=klom
I have four computers running 24 hours a day automatically downloading and processing weather models. I access these on mobile via a vpn. For excellent weather model data visualization, I use LuckGrib to display my own downloaded data. There is no better app than this for weather grib data visualization, available for iPhone, iPad or Mac.
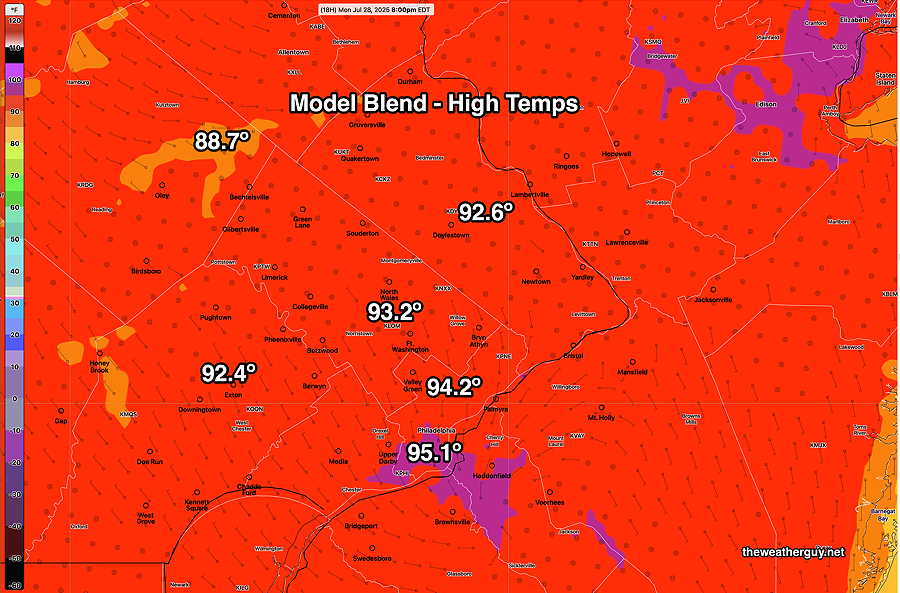
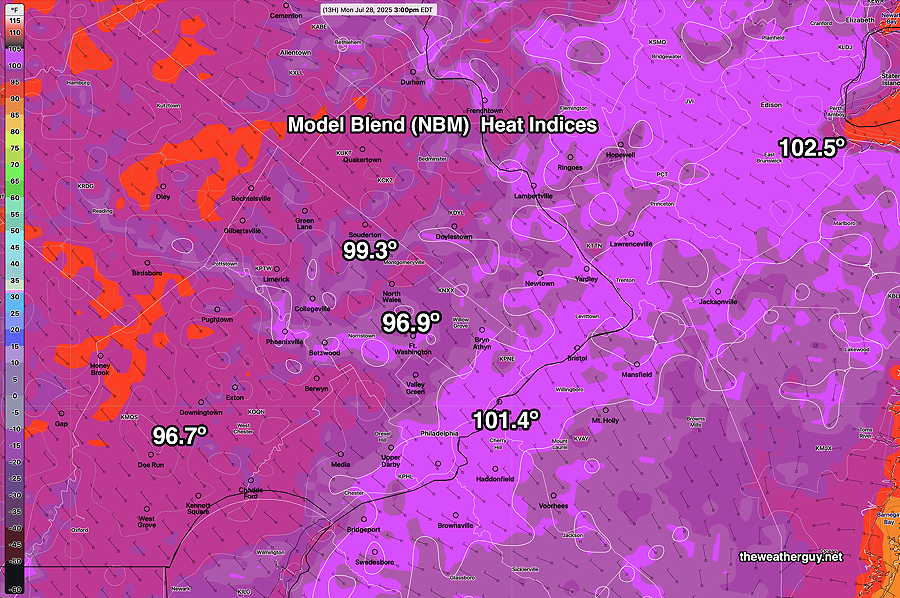
Posted Monday 07/28/25 @ 9:10 AM — No news here. It’s going to be hot and humid. Here’s the model blend (NBM) forecast highs and heat indices—
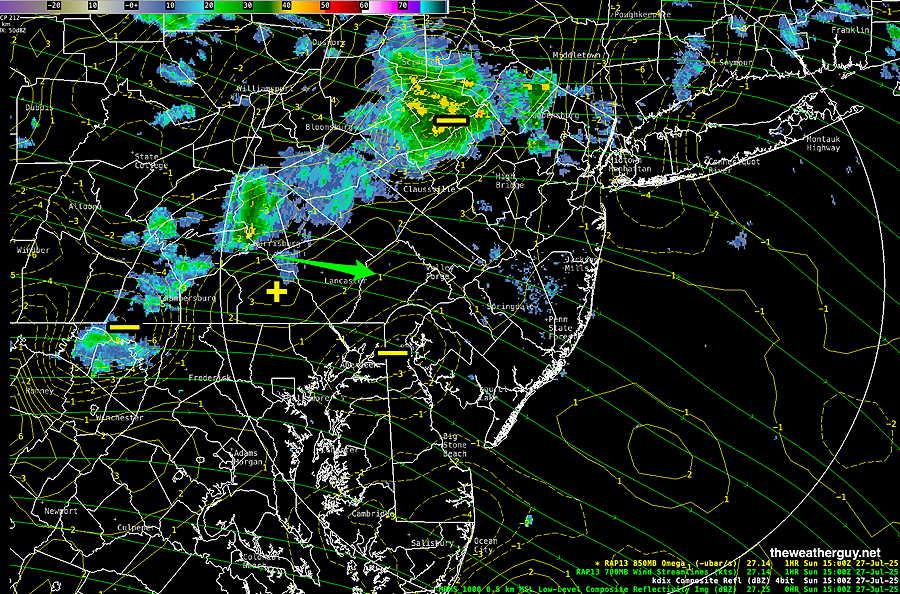
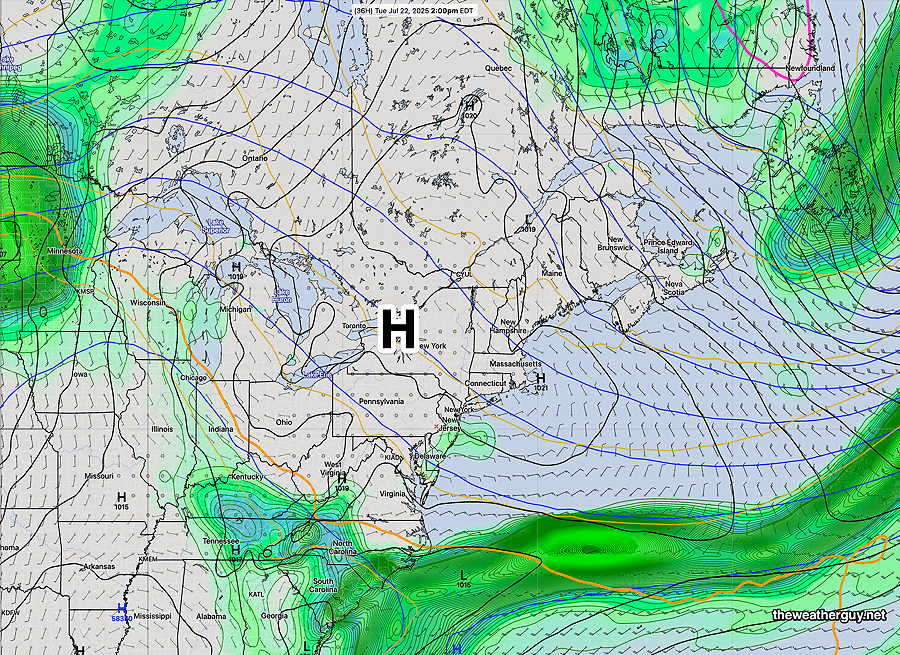
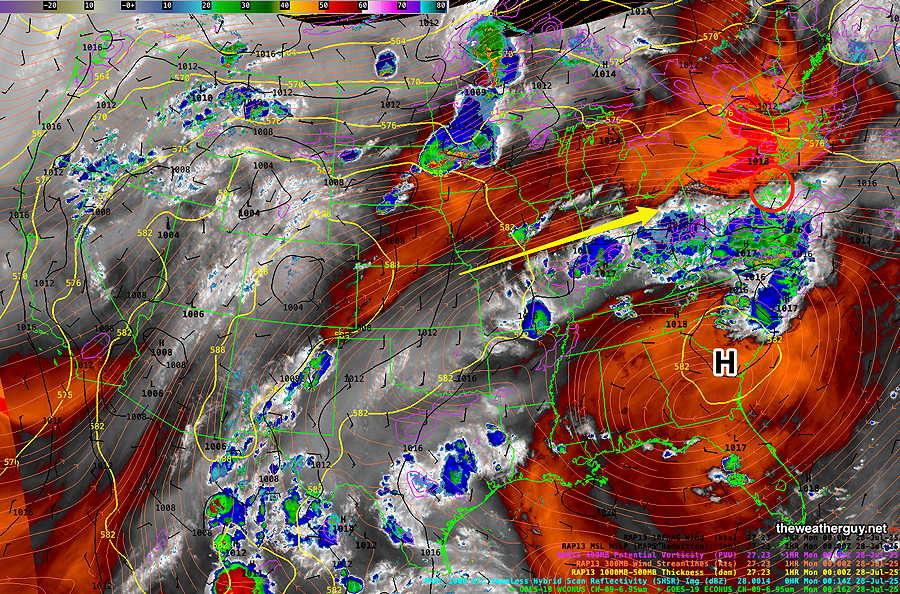
Originally Posted Sun 8:40 PM —A very hot and humid flow of air returns for first half of this week. The upper level high pressure “heat dome” will be centered over the Southeastern US.
Water vapor imagery shows the upper circulation and the RAP model thickness over South Carolina is 582 dm which is quite high, indicating a very hot air mass. The clouds to our south are associated with the showers that moved through today—
High temperatures over the next few days will be in the 90s with heat indices exceeding 100º here. Here’s the latest NBM forecast temps and dew points for Blue Bell—
Thunderstorms likely Wednesday into Thursday.