
#Philadelphia #weather #PAwx #PhillyWx
Monday
Posted Monday 07/28/25 @ 4:02 PM — I didn’t want to say this, but this “heat wave” seems just a bit over-hyped by the media. Today’s dew points were significantly lower than had been forecast resulting in heat indices that were lower as a result. It’s summer, it’s 93º.
If actual temperatures were approaching 100º, I could understand the use of “extreme” in the forecasts , but..
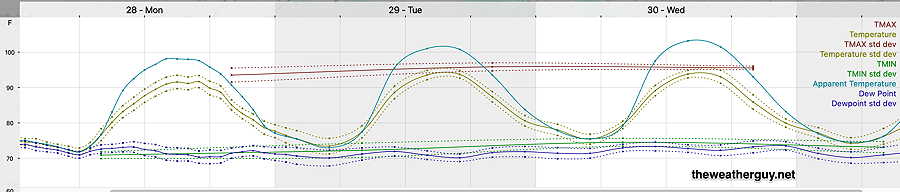
Here’s the official data from PHL airport—
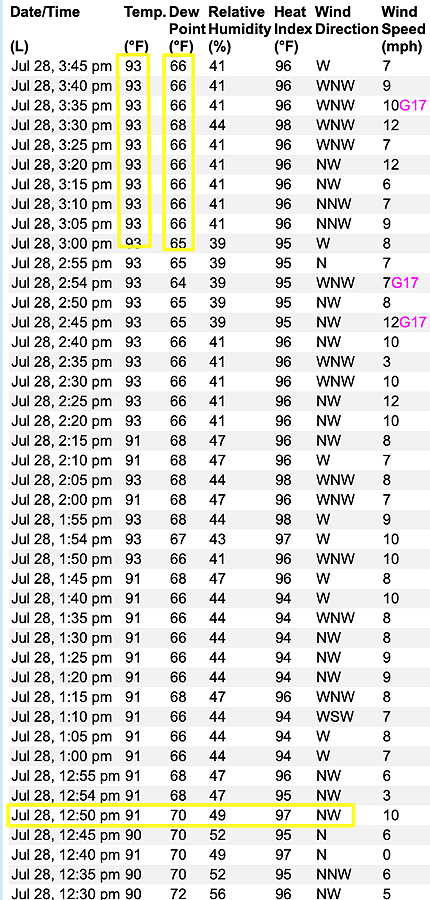
(Click on image for a larger view.) Source: https://www.weather.gov/wrh/timeseries?site=kphl
That said, actual temperatures are expected to be higher on Tuesday and Wednesday. But it’s not unusual to have dew point temperature forecasts go wrong and that’s another reason why “Feels Like” temperature forecasts can sensationalize and be inaccurate to boot.
BTW, over past years, I’ve been asked which is my favorite weather app for mobile. Many of them are quite ok and I don’t use any particular one.
I really use my mobile web app (Safari) and and I really like this official web site for local conditions: NWS IDS Forecasts
For live radar, I like something that’s truly live. Many of the apps are delayed images. I’ve subscribed to WeatherTap for over 26 years. They’re not cheap, but I like their radar images on the go.
Adding to that, I use a this for current conditions in nearby official sites—
https://www.weather.gov/wrh/timeseries?site=kphl
https://www.weather.gov/wrh/timeseries?site=klom
I have four computers running 24 hours a day automatically downloading and processing weather models. I access these on mobile via a vpn. For excellent weather model data visualization, I use LuckGrib to display my own downloaded data. There is no better app than this for weather grib data visualization, available for iPhone, iPad or Mac.
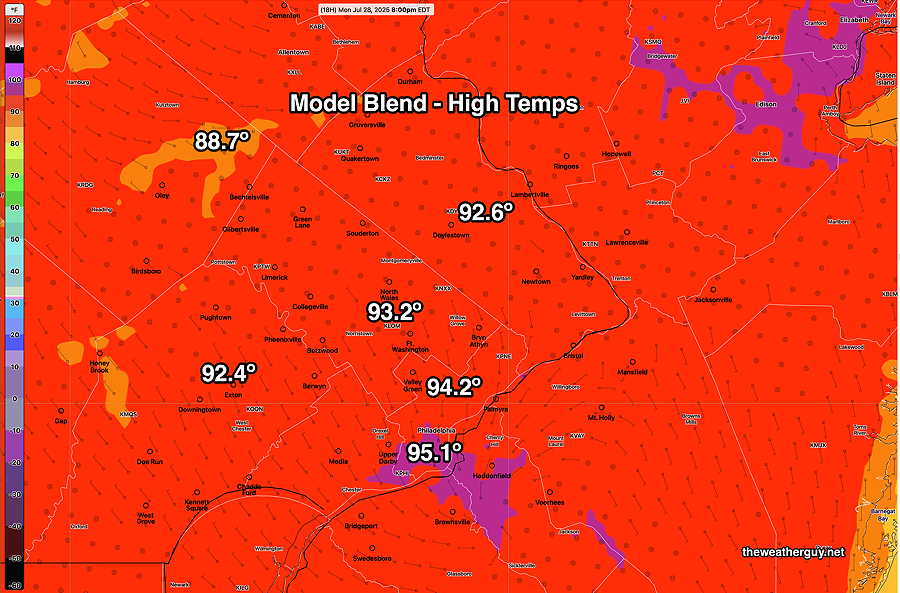
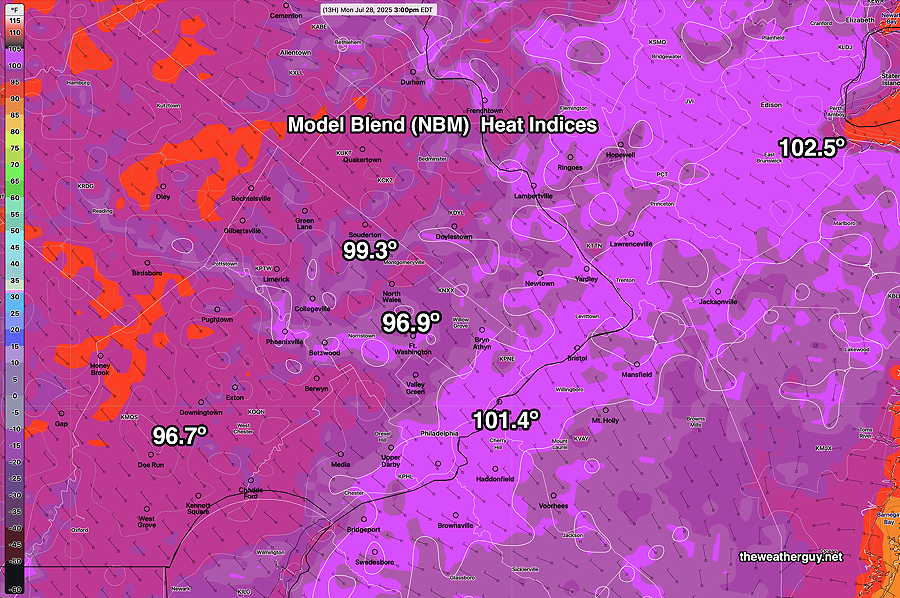
Posted Monday 07/28/25 @ 9:10 AM — No news here. It’s going to be hot and humid. Here’s the model blend (NBM) forecast highs and heat indices—
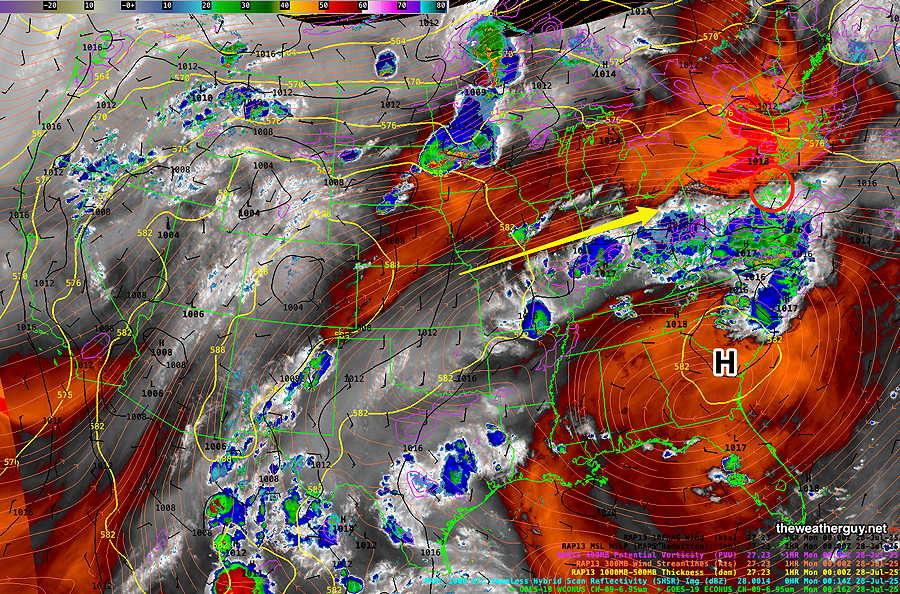
Originally Posted Sun 8:40 PM —A very hot and humid flow of air returns for first half of this week. The upper level high pressure “heat dome” will be centered over the Southeastern US.
Water vapor imagery shows the upper circulation and the RAP model thickness over South Carolina is 582 dm which is quite high, indicating a very hot air mass. The clouds to our south are associated with the showers that moved through today—
High temperatures over the next few days will be in the 90s with heat indices exceeding 100º here. Here’s the latest NBM forecast temps and dew points for Blue Bell—
Thunderstorms likely Wednesday into Thursday.