
A reader asks—
“If you have time to indulge, would you mind explaining the difference between the ICON and NBM models (the later I believe is a blend of models?), with an eye towards which rain forecast for tomorrow (modest or healthy) is the one you lean towards?”
Good question and I’ll do my best to [try] to keep it simple and straightforward.
First, I should say the latest NBM model has moved towards the ICON model with over 1.25 “ rain (ICON model- 1.6”) for Friday afternoon through Saturday morning. mid-afternoon, then cloudy. Sunday cloudy with light rain again towards evening. Clearing Monday early morning.
Complete forecast on Friday.
NBM
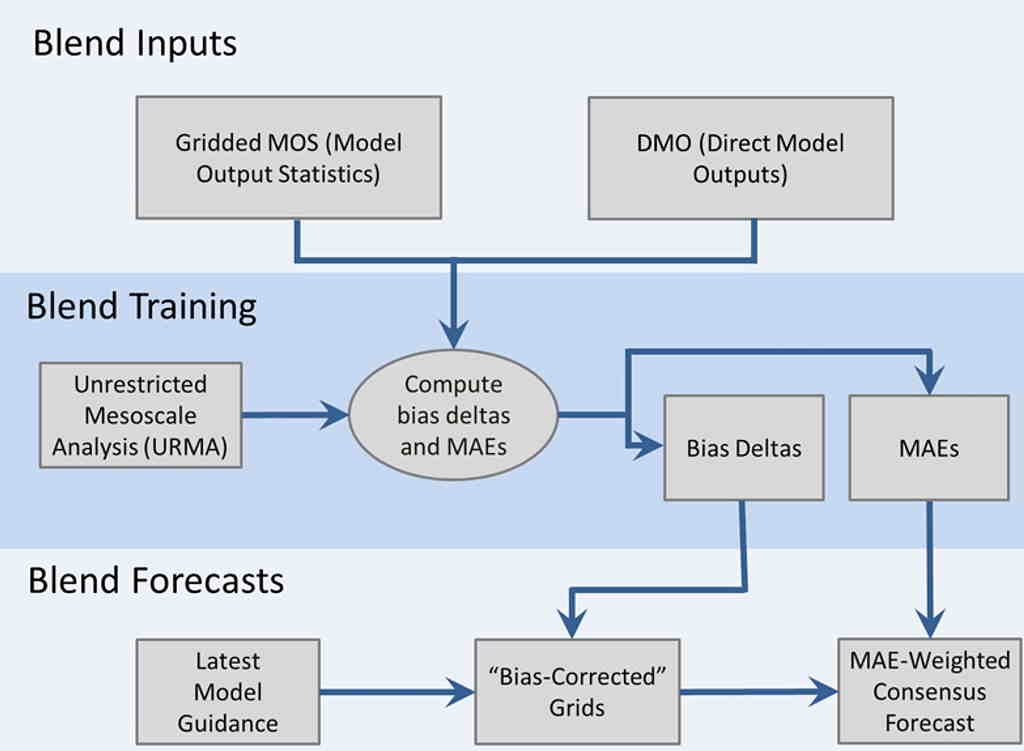
The NBM is the “National Blend of Models”, a blend of many different models that is run hourly by NOAA. It’s an increasingly accurate composite model that statistically evaluates numerous other model’s inputs, determines their biases and errors, and comes up with a better forecast. For temperature forecasts alone, it’s pretty complex—
Numerous models are part of the blend. While it is called the “National Blend of Models”, the NBM now incorporates the European Models, Canadian Models and the Australian models. It includes all of the NOAA models- GFS, GEFS, NAM, NAM-NEST HRRR, HREF, SREF, HIRESW, RAP, GFS-MOS, NAM-MOS, EDKMOS, etc.
On an hourly basis, the NBM starts with the hourly HRRR model , adds each of these other listed models above on a regular schedule, and compares their forecasts to something called URMA, which is an error-corrected measurement of actual observed conditions six hours previously. It basically sees which model is doing better from actual measurements six hours earlier and weights that towards a better composite forecast.
The NBM model is available as a standard model in “grib” format and also available as a text file.
If you want to see the latest NBM forecast in text version you can click here for Philadelphia and Blue Bell.
ICON Model
The ICON model is a German global (and regional) weather numerical prediction model from Deutscher Wetterdienst. It is run 4x daily, every 6 hours. What’s interesting about the ICON is its unique attempt to reduce computational errors by slicing/dicing up the atmosphere into icosahedrons (pyramids) instead of spherical cubes, which is what the new GFS-FV3 uses. FV3= is Finite Volume Cube).
All numeric weather prediction models divide up the atmosphere three- dimensionally. The geometry of each model, and the number of vertical levels and the horizontal size (resolution) determines its computational load and the amount of computational error created. (Many of the equations for weather prediction become infinite series calculations that require cut off. Successful geometric calculation can reduce the cut off error at the top of the troposphere. )
I’ve already gotten too technical, but the ICON is what is called a “non-hydrostatic model”, meaning it’s good at small scale vertical motions associated with thunderstorms and precipitation.
Why do I use the ICON model? It seems to do very well with temperatures, cloud cover and high precipitation events. I’ve been surprised how good it is. When the NBM shows high statistical spread (uncertainty), I lean towards the ICON forecast if it’s within the NBM spread.
It’s been a challenge for me to learn how to download the ICON and convert it. Since it’s icosahedral in geometry, it takes one of my old iMacs, used as a dedicated server, over an hour to re-interpolate the model into the standard latitude and longitude format and reduce its file size to something manageable. And that’s the time needed to download and convert only a few parameters!
I don’t know why the ICON is not included in the NBM and I’m not aware of any research papers comparing the ICON to other models. But I’m sure they’re out there somewhere on Google.