NBM- NATIONAL MODEL BLEND ISSUES

The National Weather Service/NOAA creates a weather prediction model that is a statistical composite of many different models— it’s called the “NBM” or “National Blend of Models”.  The NBM is created and updated hourly by NOAA and is the product of about 8-9 years of development.   It’s current version, 4.0, became operational this past December 2020.

The NBM is a sophisticated and advanced attempt to combine  the best forecasts of numerous weather models including multiple U.S. short/long range/ensemble models, several Canadian models/ensemble models and the European model/ensemble models.  It also combines various “model output statistics” (“MOS”) and hourly “LAMP” forecasts.

It attempts to achieve its aim by re-examining the forecasts of the models hourly and comparing those forecasts to actual measurements adjusted to actual measured conditions six hours earlier.   From the comparisons to actual conditions, it statistically weights the forecast going forward to the best performing model(s) six hours earlier.

The NBM ingests different model runs and forecast statistics at scheduled times during the day and creates a variety of forecast products, including maximum/minimum forecast temperatures and precipitation forecasts.

The NBM is the model I’ve been using for my high temperature forecasts.

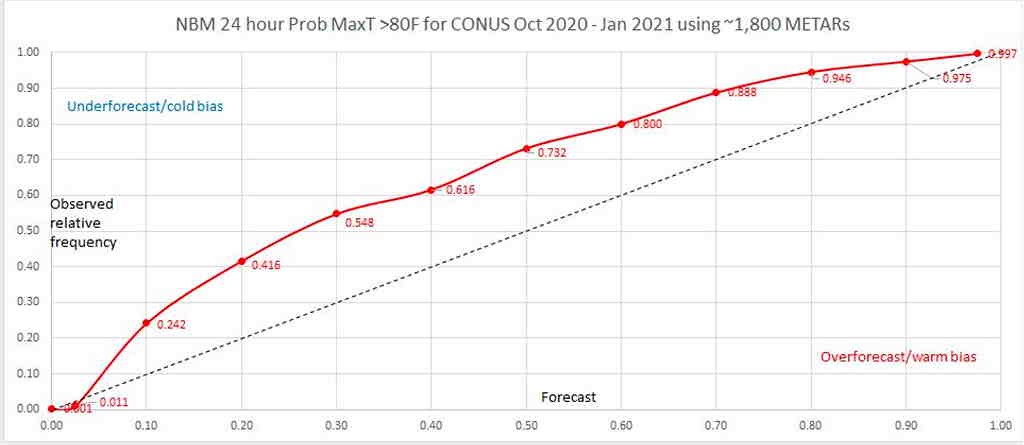
I’ve noticed something for awhile, recently confirmed today by an official notice.   The NBM high temperature forecasts (“TMAX”) are too low,  and the error is higher with higher expected TMAX temperatures.

(I’ve been including the “sd”(standard deviation) in my forecasts for months.   I’ve noticed that the actual TMAX is often a degree or so higher than the NBM predicted value PLUS its standard deviation.)  

Today, the NBM predicted TMAX for Blue Bell was 49º with an sd of 4.4º  The actual TMAX was 53º.

So the actual TMAX  was = TMAX + sd!

The NOAA statistical modeling group today released a report today.  This graphic captures the problem of the cold bias in the NBM max temp forecasts.

NBM TMAX Bias  (Click on image for a larger view.)


With this disclosure, I’ll be getting rid of my inclusion of the standard deviation in my forecasts (as had been my practice these past six months) and instead will simply be adding the sd to the forecast high temp going forward…and hoping for the best.

With the recent disclosure that the precipitation statistics are also biased too low, we can hope for an early  release of  NBM version 4.1 or NBM v.5.  (Actually, the precipitation problem is being addressed with an update in March.)

MONDAY’S SNOW TO RAIN

Mon 08:32 PM Forecast Review —We had more snow than forecast.  The models (with the exception of the Canadian GEM model) underestimated the QPF and didn’t fully take into account the cold upper level atmospheric temperatures, which resulted in more snow and less rain. The NAM erroneously hastened the transition to rain, despite having the QPF somewhat in-range.   

The Canadian “Regional GEM” model is one model I always look at, but it it isn’t necessarily a model that is more often accurate.  I’ve seen it over-estimate snow totals many times.   Last night’s GEM had these higher snow totals, but as I said, “Not sure what to make of it” 

Here are the NWS official snow totals:Here’s the graphic posted yesterday afternoon from the GEM model—

CMC GEM Model Snow totals 


Here’s the GEM model that I looked at 11 PM last night but I didn’t know what to do with—

Last night’s Canadian GEM snow totals.  (The GEM shows snowfall as snowfall rate in Kg2/m2)  These numbers are correct.  The 4-5″ mentioned in last night’s  “update” was a quick, mental approximate conversion to inches of snow.)


Update— Tonight’s Canadian model continues to forecast 4-5 inches of snow in central parts of Montgomery county.  Not sure what to make of it. 

Tonight’s latest models (HRRR, RAP, NAM)  shows the following changes— snow changeover a bit delayed northwest of the city, although snow totals are pretty much the same.  (It might be snowing an hour longer, but it will be increasingly difficult for accumulating snow.)

Dark, paved roadway surfaces will likely see less accumulation than grassy surfaces.

Snow starts about 9-11 AM from west to east and changes to rain from southeast to northwest by 2 PM.    Precip ends 3-4 PM.

The differences with this storm and recent previous storms  were outlined in an earlier post:

  •  The models have been consistent with total water falling (QPF) will only be 0.3-0.4″ water equivalent or less in the immediate PHL area, in  contrast to much greater amounts in previous storms.
  • The thermal structure of this storm is vastly different.   This storm will have southerly winds at the surface and surface temperatures will be at or above freezing for most of the area once things get going.   (Previous storms had northeasterly or easterly winds at the surface.)
  • In contrast, upper air temperatures will be colder northwest of the city, supporting snow formation but the surface temperatures will go against accumulation.
  • We’re into the final part of February.  The solar angle is higher and “insolation” effects through clouds are more likely to interfere with and cause melting on dark asphalt road surfaces when the precip occurs during the daytime hours.

Things can be summarized with this graphic slide show:

  • RAP model 10 AM Precipitation moves in
  • NAM model 1 PM Changeover northwest of the city. (note 32º surface temp white line)
  • RAP model Snow totals 4 PM


RAP model snowfall on grassy surfaces.  (Click on image for a larger view.)